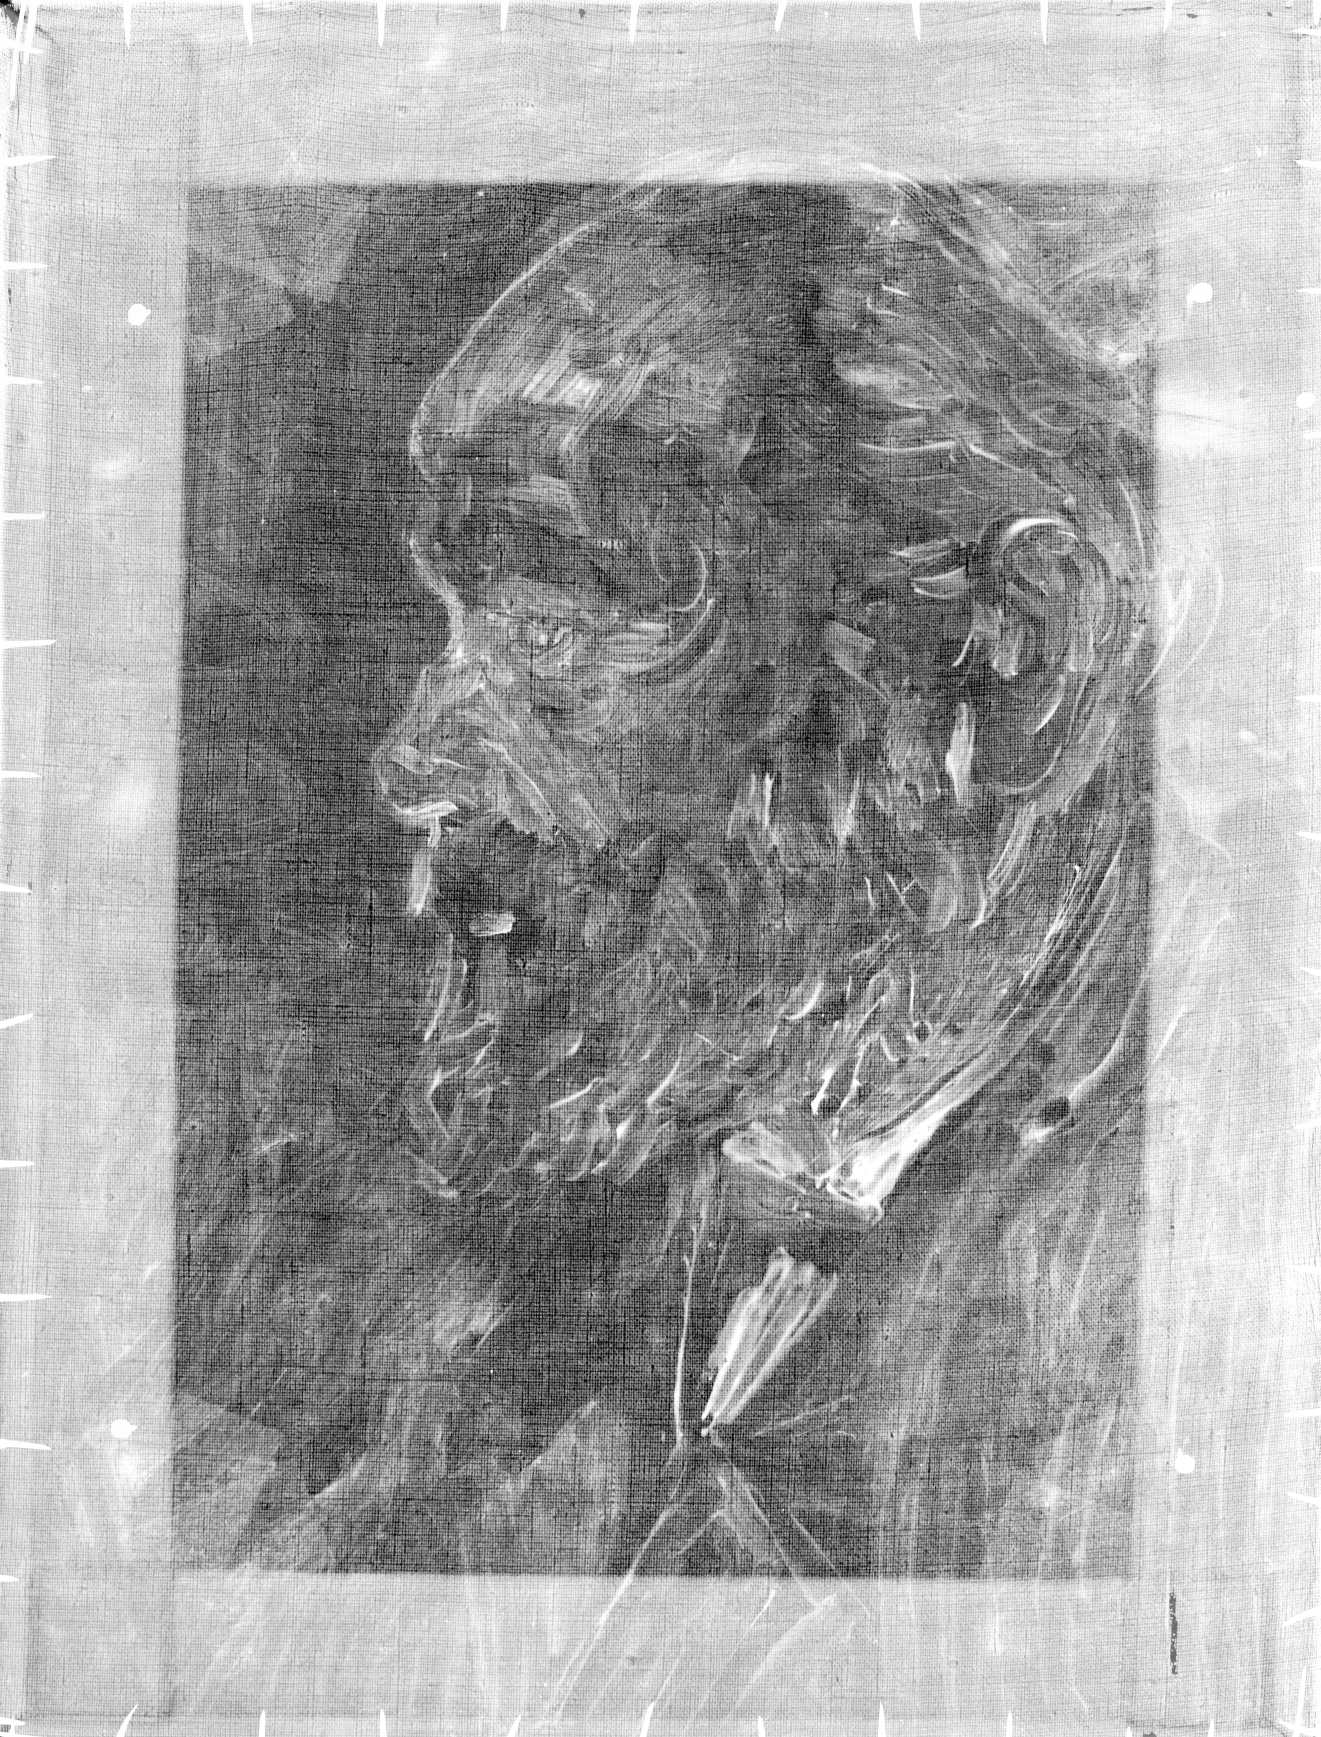
X-ray of Man with a Beard, Vincent van Gogh, van Gogh Museum. |
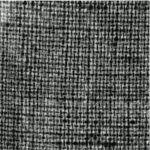 Original x-ray swatch |
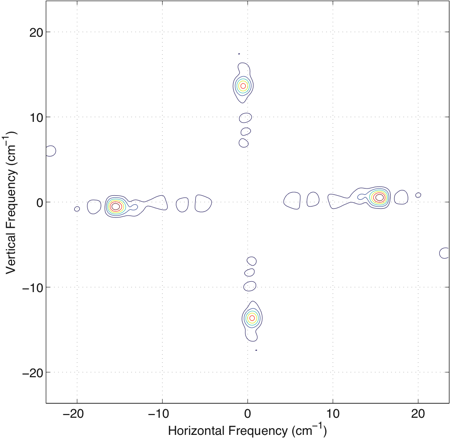 Contour plot of the spectrum. Largest values indicated by red, smallest by blue. |
This web page demonstrates typical results as well as frequently occurring departures from “normal,” explaining how they are interpreted.
|
X-ray of Man with a Beard, Vincent van Gogh, van Gogh Museum. |
Original x-ray swatch |
Contour plot of the spectrum. Largest values indicated by red, smallest by blue. |
|
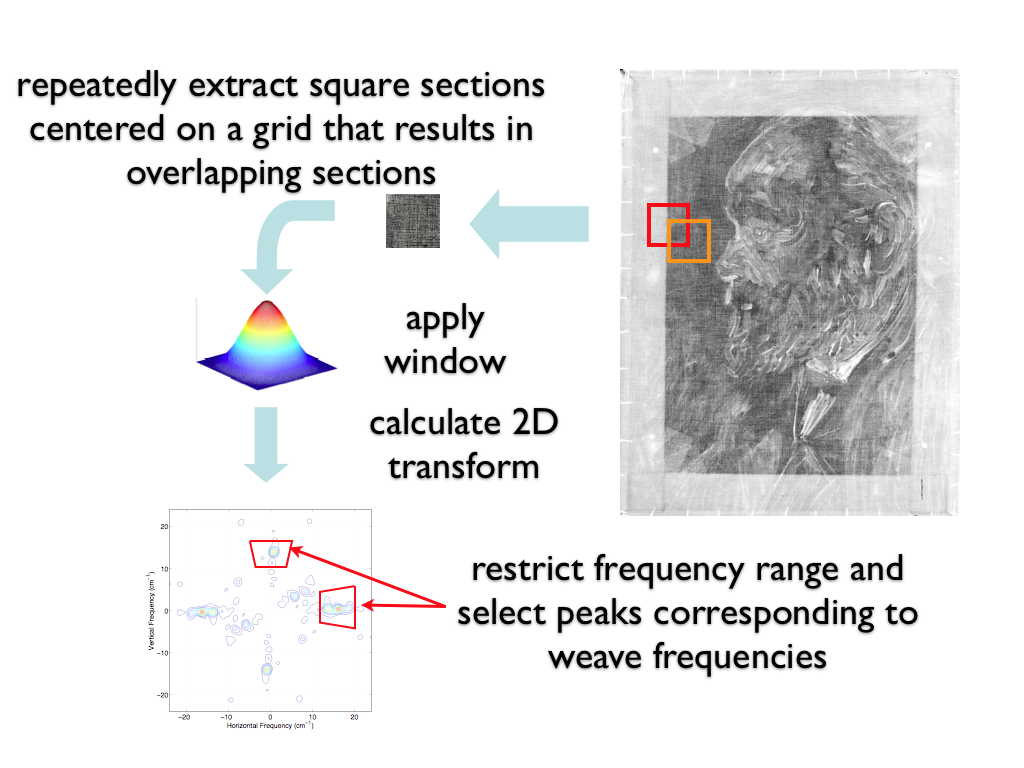
To calculate a thread count map over the entire painting, we break up the painting's x-ray into overlapping squares, evaluate the spectrum for each and search for peaks near the horizontal and vertical axes. Algorithm details and the theoretical underpinnings can be found here. |
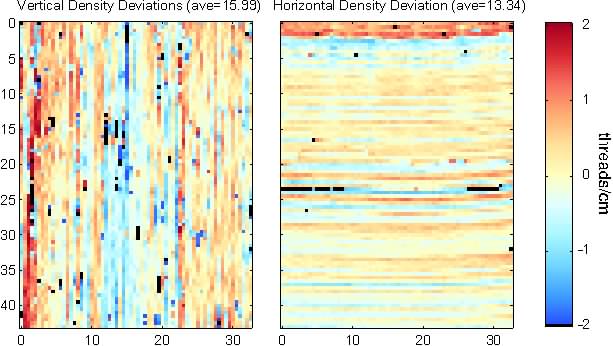
Man with a Beard, Vincent van Gogh, van Gogh Museum. |
The axis labels express distance from the top-left corner in centimeters. On the right side is a colorbar that translates color to thread density deviation. Here, a density two threads/cm greater than average corresponds to a deep red, while two threads/cm less than average is a deep blue. The black spots show locations where the software could not determine a thread density. Note that these locations may differ for the vertical and horizontal thread density measurements. The vertical and horizontal thread densities are, for the most part, constant in the thread direction. We have found that the degree of this consistency reflects the warp/weft weaving direction, with warp always being more consistent. In this case, the horizontal threads are the warp threads. A paper is being prepared that details this determination. |
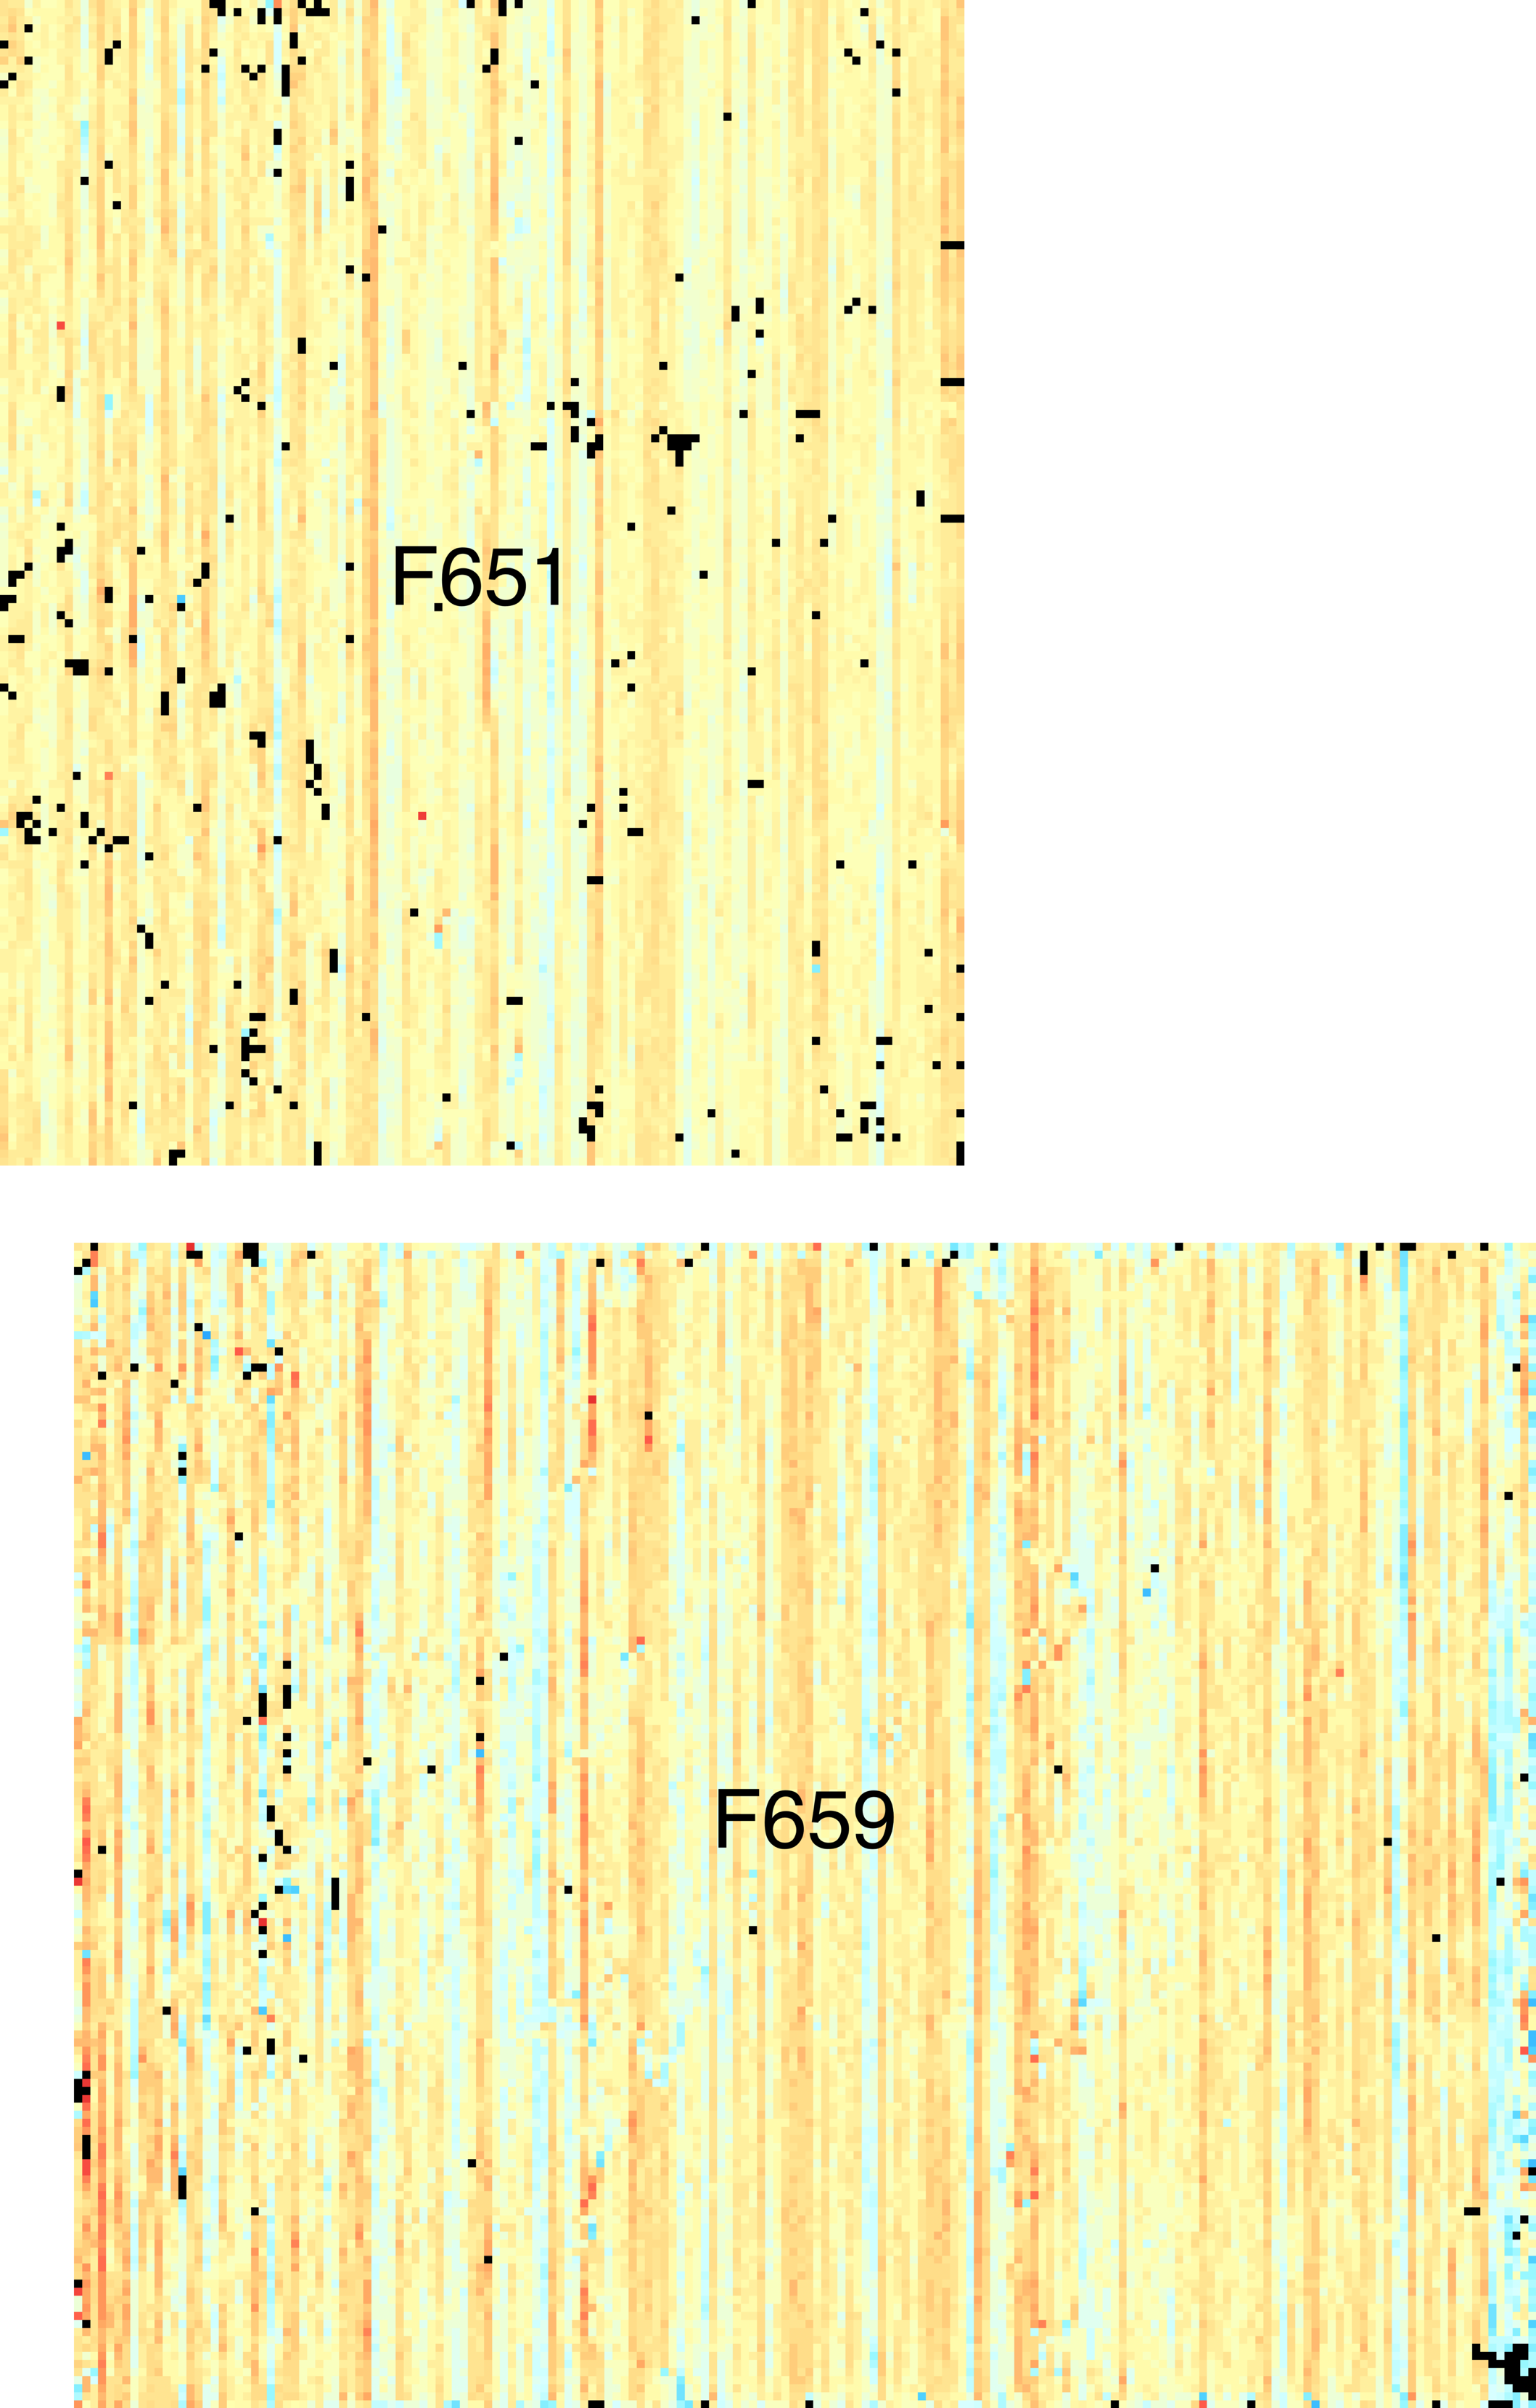
Warp thread density maps for The Walk: Falling Leaves (F651) and The Garden of Saint Paul Hospital (F659), Vincent van Gogh, van Gogh Museum. |
Two paintings (F651 and F659) by van Gogh that have been aligned according to their matching warp thread density patterns. |
Because of the consistency of the horizontal and vertical thread densities along their respective thread directions, seams and non-original canvas replacements can frequently be easily spotted.
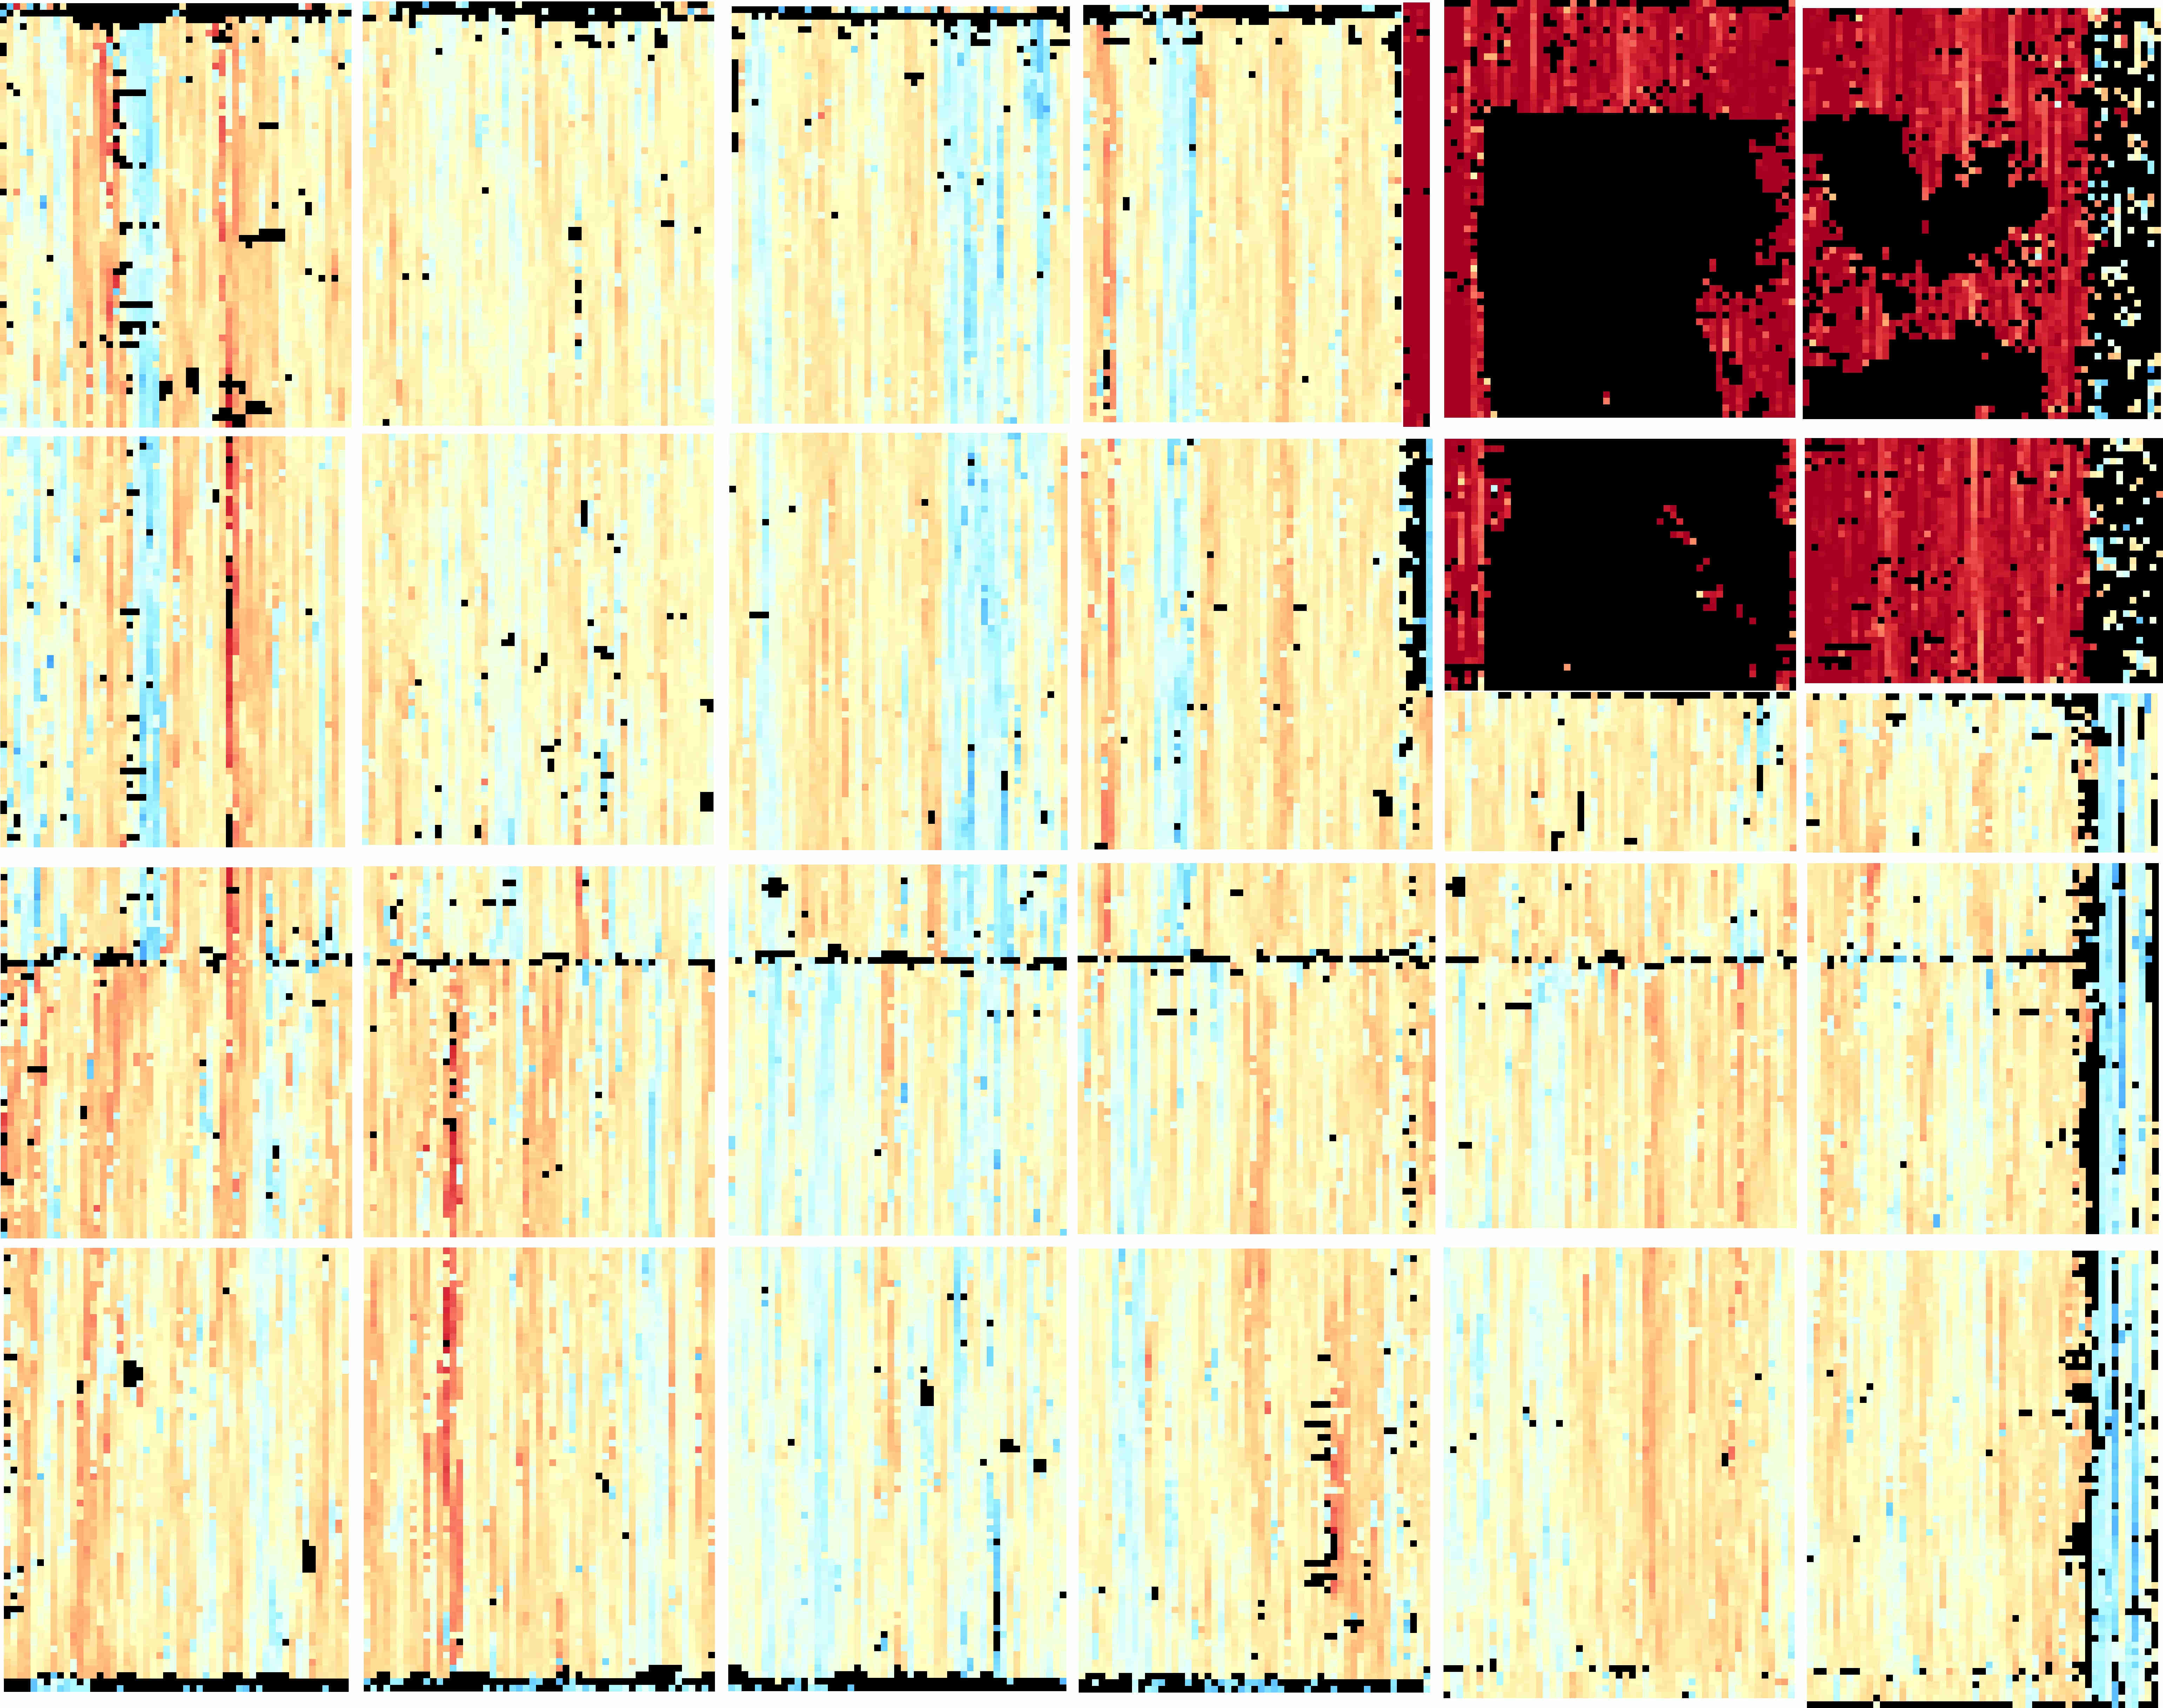
Saul and David, Rembrandt van Rijn (and studio?), Mauritshaus, The Hague. |
This painting's weft thread density map shows that six distinct canvases have been sewn together. The presumption is that those sections having very different thread densities from the main section correspond to restorations. The horizontal line slightly below center corresponds to a seam. The vertical thread density suddently changes along this boundary. Because the two sections have about the same density variations, the presumption is that the painting’s canvas came from two horizontal canvas sections that were sewn together. In such cases of a long seam, seam direction corresponds to the warp-thread direction. The deep red of the upper right corner indicates a sharply higher thread density of the rest of the canvas. The light blue section along the right side indicates a much lower thread density than the main section. Because the x-rays do not overlap, white gaps occur in the density map. |
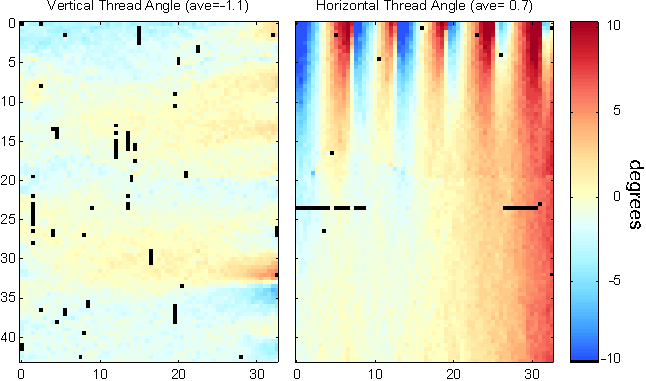
Man with a Beard, Vincent van Gogh, van Gogh Museum. |
The colorbar shows how to translate color to thread angle. Here, an angle 10 degrees from horizontal/vertical corresponds to a deep red or a deep blue. Positive angle corresponds to a counter-clockwise rotation. The black spots in angle maps correspond to the same locations in the respective thread density maps where no measurement could be made. |
The angle maps have proven to provide much information about the preparation process, whether performed by the artist or commercially, and about the weaving process.
Both angle maps in this example show clear angle variations along the edges, with the horizontal threads varying much more (stronger colors) than the vertical ones. Such variations along the edge correspond to cusping, with strong cusping illustrated by the horizontal threads along the top edge, weak cusping by the vertical threads along the right edge. The locations where the canvas is atached to the stretcher can be discerned from angle maps: they are located where the angle map colors change rapidly from red to blue.
Cusping can reveal how the canvas was mounted on the stretcher and prepared.
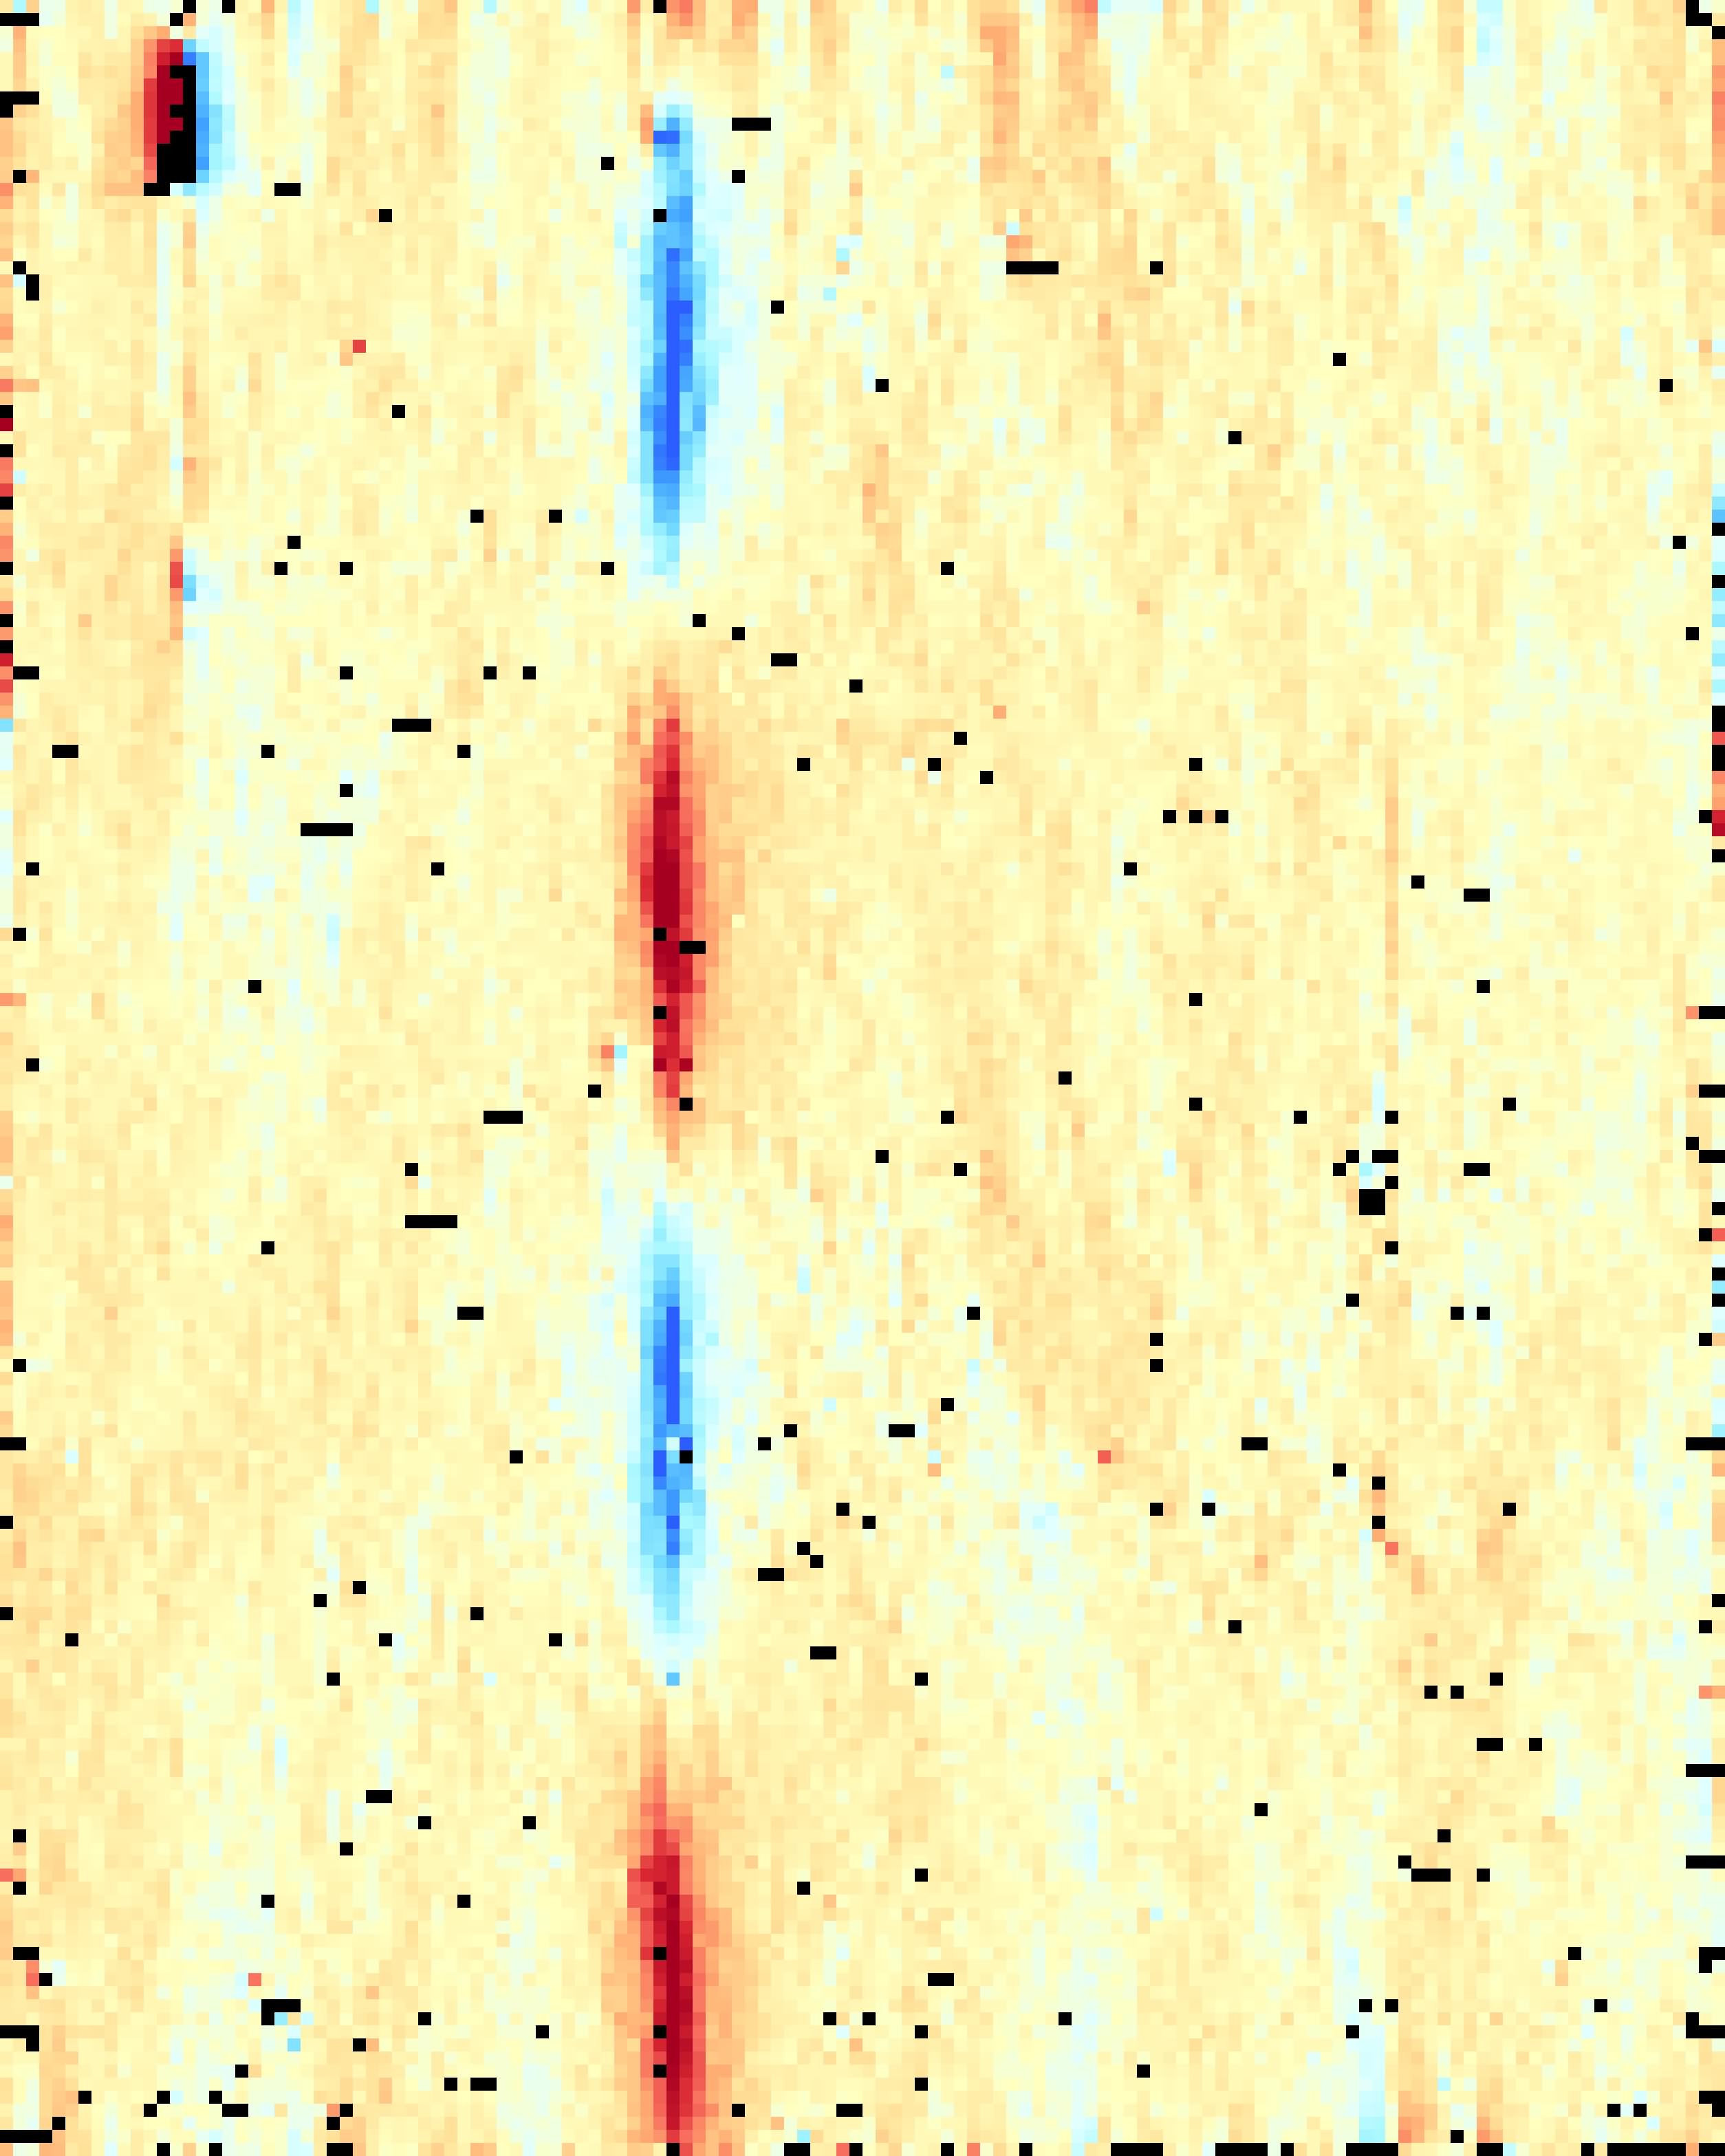
In some paintings, a subtle cusping-like feature can be seen in the weft angle map away from the canvas's edge that runs across the painting.
The Art of Painting, Johannes Vermeer, Kunsthistorisches Museum, Vienna. |
About a third of the way down from the top is a horizontal, cusping-like feature that we call a “weft snake”. It extends across the entire canvas and always occurs in the weft-thread direction, serving as reliable indicator of the weft-thread direction as selvedges. Research has show that this is a hand-weaving fault that occurs occasionally: some paintings may not have one at all and others may have more than one. It occurs in paintings across the centuries, lessening in occurrence with the rise of power looms. This painting shows symmetric (same depth) cusping along the top and bottom, indicative of canvas preparation on the stretcher and not having been trimmed.
|
The weft angle map may express starburst-like features.
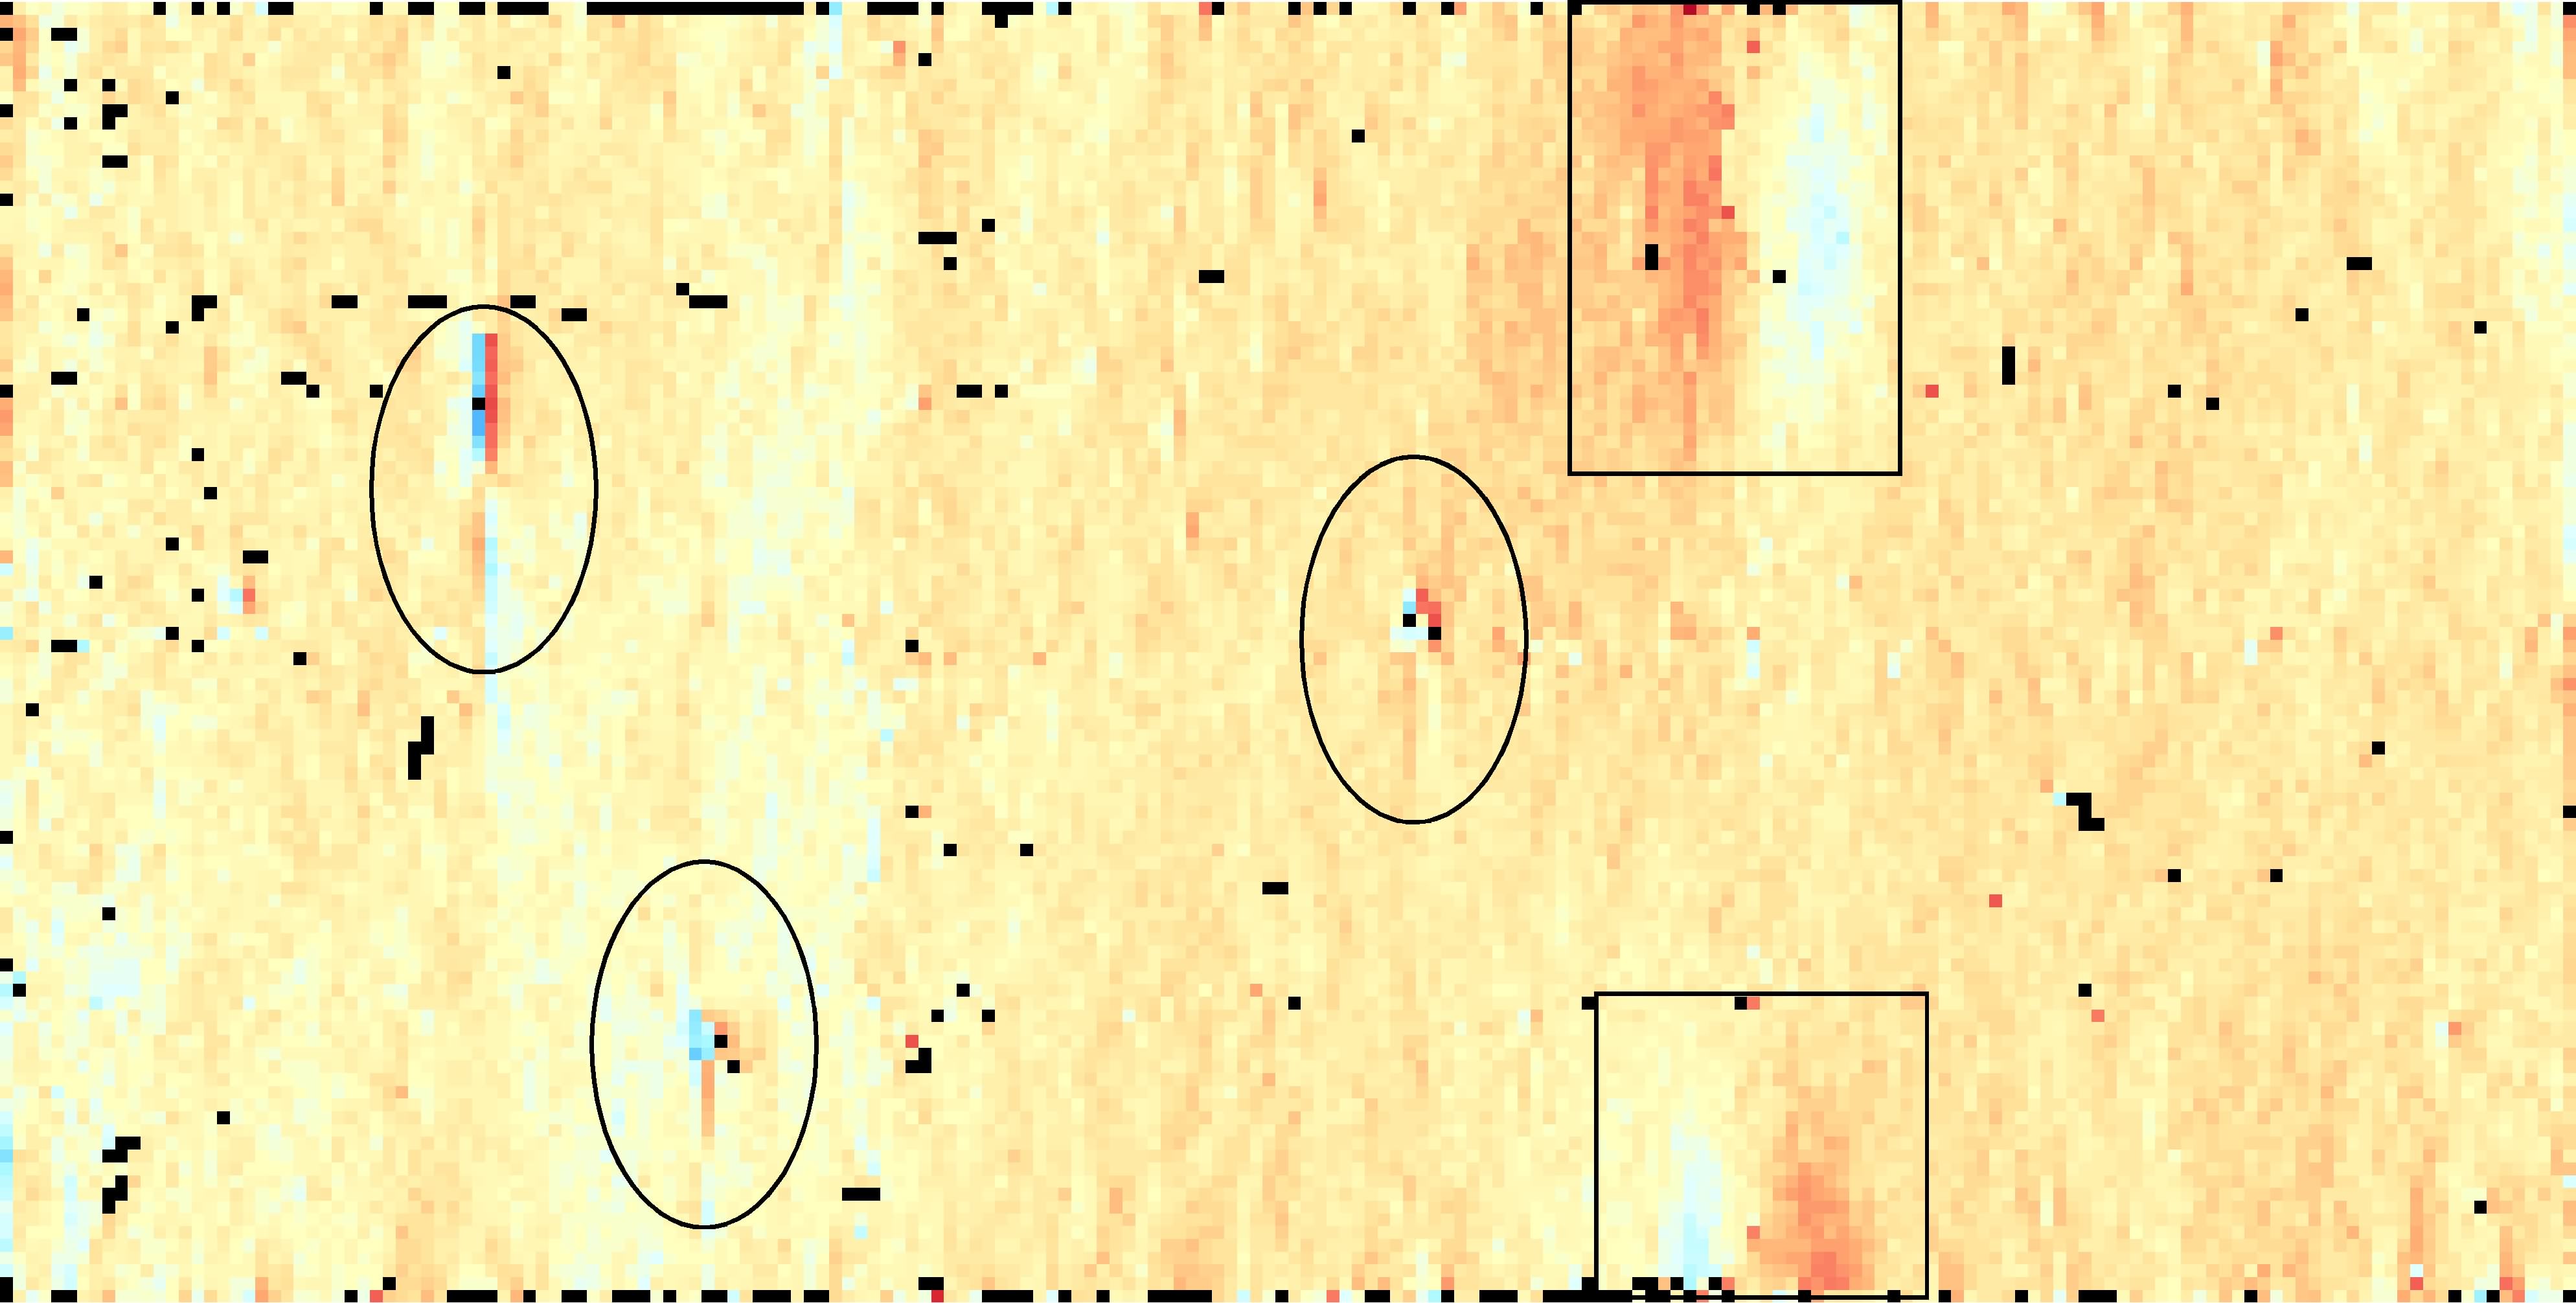
Tree Roots and Trunk, Vincent van Gogh, van Gogh Museum. |
Encircled by ovals are three warp-thread repairs, distinguished by a burst or color. These only occur in the weft angle map and correspond to warp thread repairs made during the weaving process. We have found these in late nineteenth century paintings on canvases made on a power loom. Such repairs occur sporadically and can’t be used for weave matching. The frequency of repairs is low: in this example, the painting’s dimensions are 50×100 cm. |
The above example also shows diffuse red/blue color clouds, located within the rectangles. A better example is shown here.
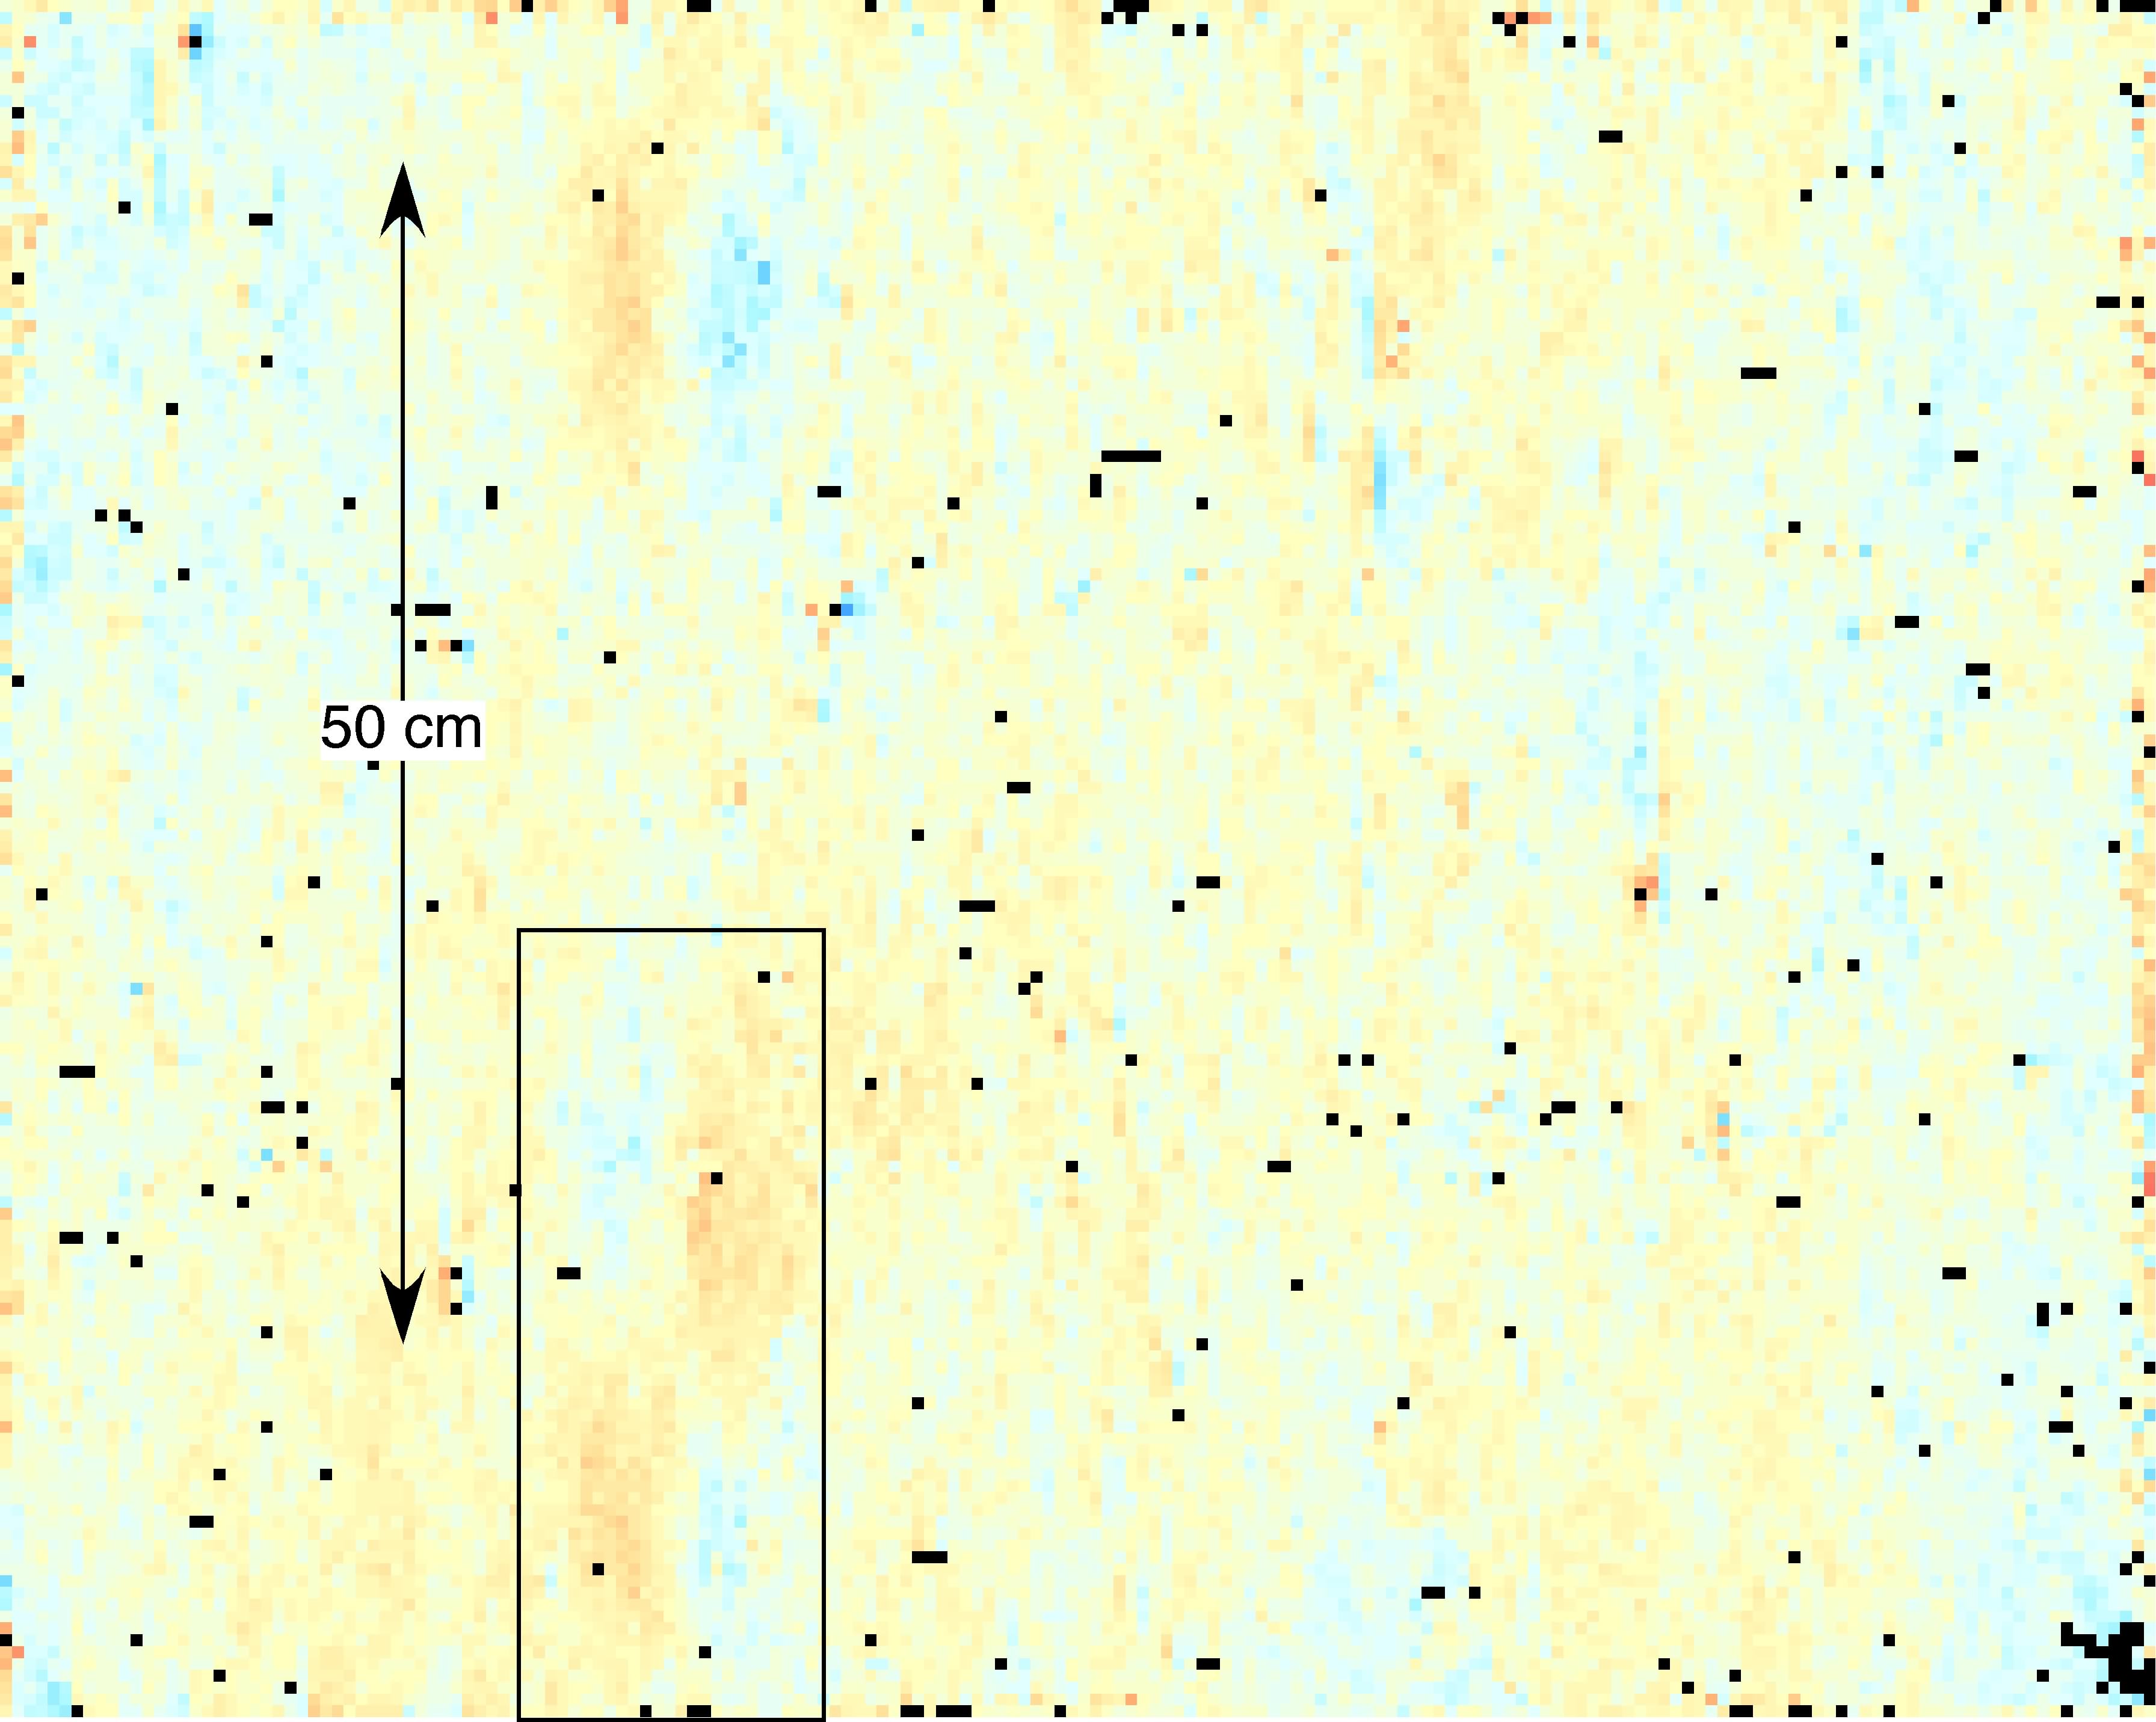
The Garden of St. Paul Hospital, Vincent van Gogh, van Gogh Museum. |
The cloud feature is enclosed by the rectangle. Over the length of a bolt of canvas, these clouds will align in the warp direction and be equally spaced, in this case about 50 cm. This feature results from the way raw canvas is delivered to the canvas preparation company. This weft angle map shows no cusping of the weft threads. Hints of warp-thread repairs can be seen. |
For some late nineteenth century canvases, we have found the telltale sign in the weft angle map of the specific kind of loom that produced the canvas bolt.
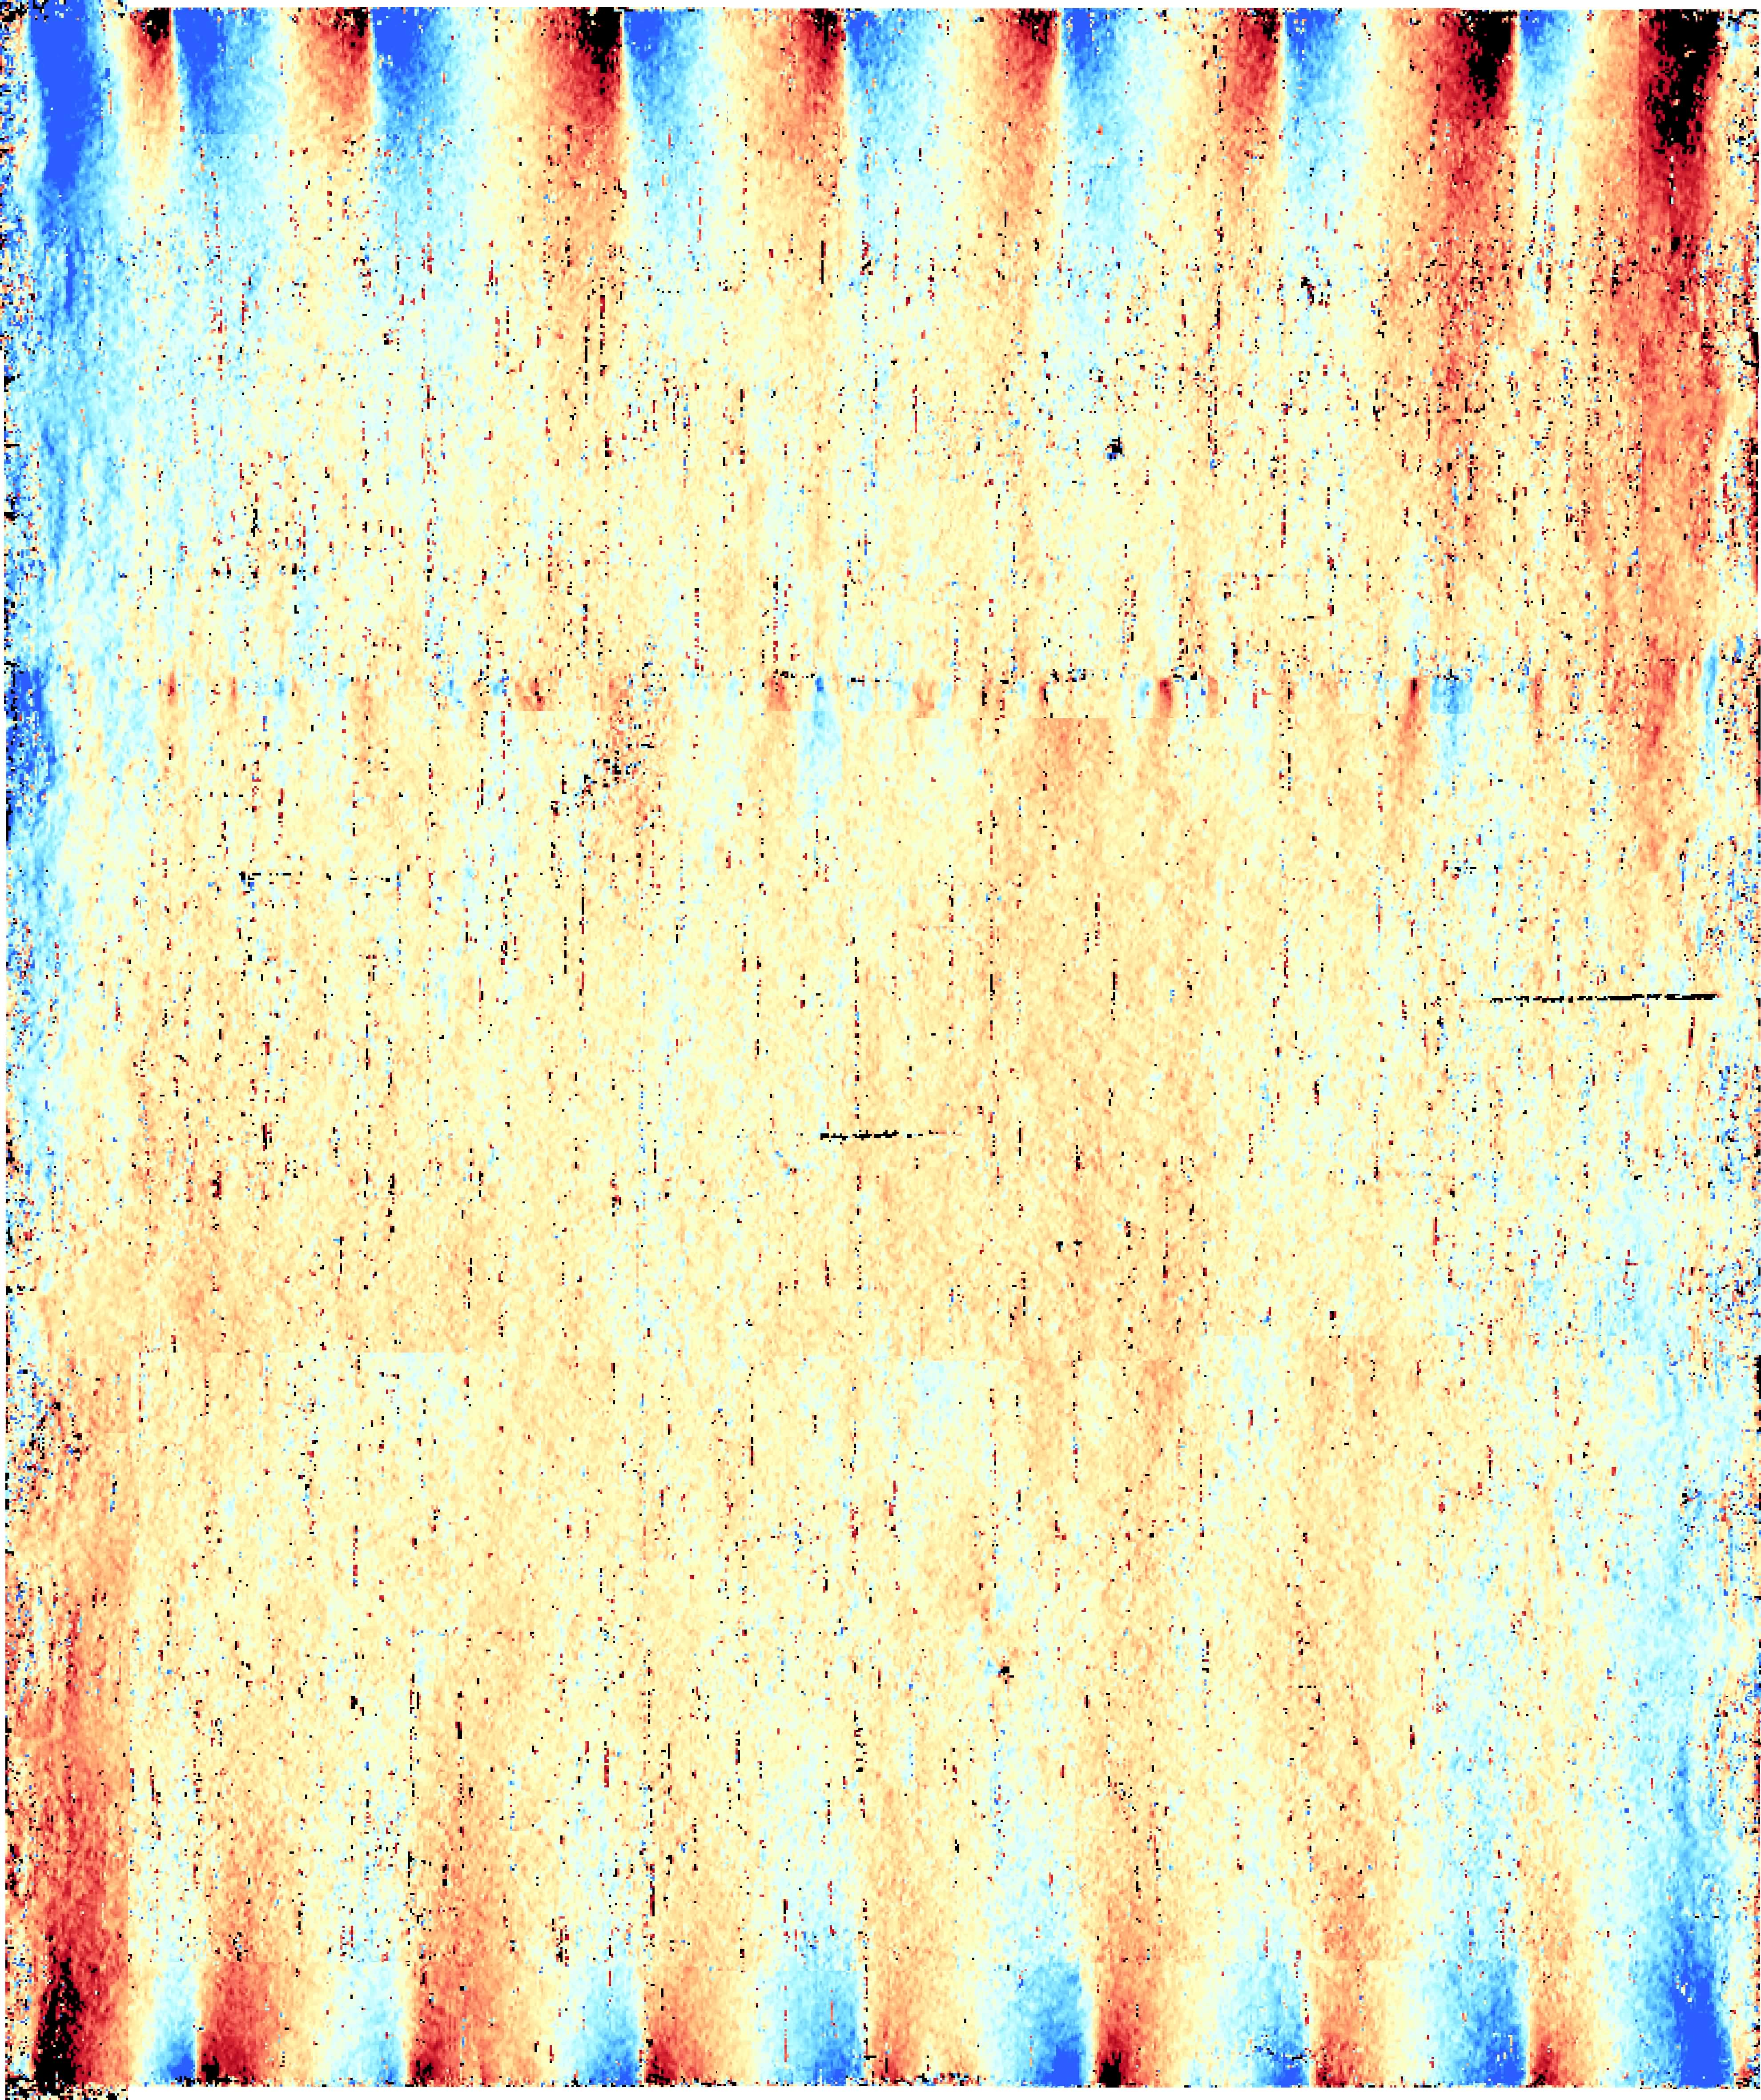
The Cafe Terrace on the Place du Forum, Arles, at Night, Vincent van Gogh, Kröller-Müller Museum, Otterlo. |
The dramatic, alternating red/blue streaks indicate the a loom half the width of the canvas manufactured this painting’s canvas. This feature locates the center of the canvas bolt. For this kind of loom, instead of the weft threads woven in a straight line, they run around a U-shaped track. It is the distortion of the weft threads going around the 180° turn that creates this feature. Two warp thread repairs can be seen on the left side in the painting’s upper third as well as weak cusping on the top and bottom. |
dhj 12.09.2011