|
| ||
Step 1: |
Connect the top bus strip on your breadboard to the red and green binding posts to form power and ground buses (just like Experiment 2.1). |
![\includegraphics[scale=0.650000]{pwr_bus7.ps}](img200.png)
|
| ||
Step 2: |
Set the
Meter Selector
switch on the power supply to
+20V.
Adjust the
0 to 20V
voltage control to produce 15 volts.
| |
Step 3: |
Use a red banana patch cord to connect the
0 to +20V
terminal of the power supply to the red
banana jack
on the breadboard.
With a green cord, connect the
Common
terminal of the power supply (blue binding post)
to the green
banana jack
of the breadboard.
| |
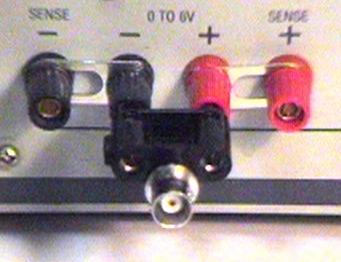
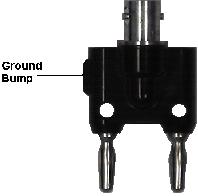
Step 4: |
Plug your
BNC-banana adapter
into the 6V supply terminals.
Be sure that the prong with the ground bump is plugged
into the negative (black) terminal of the power supply.
| |
Step 5: |
Plug one end of a BNC patch cord into the adapter.
Plug the other end into J1-3 on the interface board.
| |
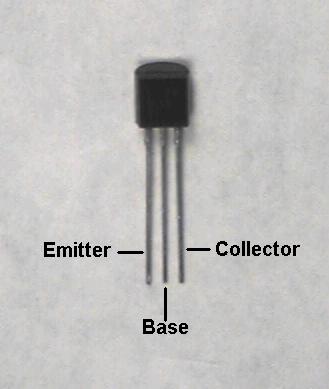
Step 6: |
Find a
2N3904 transistor
in your parts kit.
The transistor leads are identified below.
![\includegraphics[scale=1.000000]{scanl3a.ps}](img205.png)
| |
Step 7: |
Wire the following circuit: |
![\includegraphics[scale=0.500000]{ckt4.1.ps}](img206.png)
|
| ||
Step 8: |
Turn on the power supply.
Turn the
0 TO 6V
control
fully counterclockwise.
Gradually increase | |
Step 9: |
Measure the voltages across | |
Step 10: |
Compute
| |
Step 11: |
Repeat these measurements for
| |
Question 1: |
Based on the component values and the average value of beta
for your transistor,
calculate and sketch the expected voltage transfer characteristic
( |
|
| ||
Step 1: |
Set | |
Step 2: |
Increase | |
Step 3: |
Plot | |
Step 4: |
Increase |
|
| ||
Step 1: |
Set the function generator to produce a 100 Hz triangle wave.
| |
Step 2: |
Unplug the BNC patch cord from the power supply and plug it into
the function generator
MAIN
output.
| |
Step 3: |
Connect
CH 1
of the oscilloscope to | |
Step 4: |
Set the
function generator
AMPLITUDE
control to minimum.
Pull out the
DC OFFSET
control and adjust it so that
| |
Step 5: |
Increase the
AMPLITUDE
until the peak-to-peak (p-p) value of | |
Step 6: |
Measure the p-p value of the input, | |
Step 7: |
Compute the voltage gain of the linear region,
 .
Is this equal to the slope of the linear region of the
transfer curve?
.
Is this equal to the slope of the linear region of the
transfer curve?
| |
Question 2: |
Show that in the active region,
 .
Is this true for your circuit?
.
Is this true for your circuit?
|