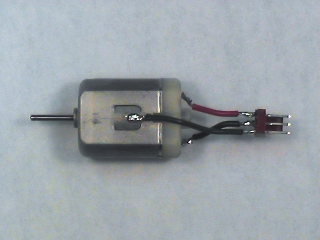
The setup for this experiment is the same as for Experiment 5.3,
i.e. we will mechanically connect two motors, using one as a
tachogenerator and driving the other with the motor amplifier.
However, instead of applying a square wave and measuring the
step response, we will apply a sequence of sine waves and measure
the
frequency response.
| |
|

|
Step 1: |
|
Disconnect the function generator from the input to the motor
amplifier.
Leave the scope connected.
|
Step 2: |
|
Connect D/A output 1 (pin 52 on the interface board socket strip) to
 .
Also connect A/D input 4 (pin 46) to
.
.
Also connect A/D input 4 (pin 46) to
.
|
Step 3: |
|
Connect A/D input 5 (pin 47 on the interface board socket strip) to
 .
.
|
Step 4: |
|
Reload the "Frequency Response" program.
Set the parameters as follows:
- Flo=0.2 Hz
- Fhi=100 Hz
- Nsteps=20
- Amplitude=10 V
- Magnitude Scale: dB
- Frequency Scale: Log
|
Step 5: |
|
Run the program.
This will take a bit longer than the other two circuits
(it takes 10 seconds to generate a single cycle of a 0.1 Hz
sine wave).
|
Question 4: |
|
As in Question 2, estimate  from the frequency response.
Compute
from the frequency response.
Compute  and compare it with what you measured in
Experiment 5.3.
Which do you think is more accurate?
and compare it with what you measured in
Experiment 5.3.
Which do you think is more accurate?
|

![\includegraphics[scale=0.500000]{ckt7.4.ps}](img240.png)