
Time-frequency analysis of seismic signals
Seismic imagery of the earth's subsurface is critical to all aspects of the oil and gas exploration process - from the location of reserves to their appraisal and subsequent monitoring.
- A seismic image of the earth is obtained by probing the subsurface with acoustic waves. When seismic waves propagate through the subsurface, a part of their energy is reflected back to the surface at acoustic impedance contrasts. The strength of this impedance contrast is called the reflectivity.
- Seismic attributes aid the interpretation of seismic data by elucidating its salient signal characteristics. Traditionally, complex-trace analysis via Hilbert transform has been used for attribute extraction. The standard seismic attributes are instantaneous amplitude, phase, and frequency.
- An example of a seismic cross-section is shown in Figure 1(a) below. The horizontal axis gives the spatial location at the surface, and the vertical axis is time. Each column of the image represents a recording of the pressure as a function of time at the corresponding surface location. The line plot to the left of the intensity image is the amplitude of the first column. The seismic cross-section represents this (bandlimited) reflectivity of the subsurface.
- Figures 1(b) and 1(c) show complex-trace IF and hybrid IF estimates (see bar01hyb.ps) of the columns of the seismic section of Figure 3(a). To the left of the images, we plot the amplitude of the leftmost column. The wild fluctuations in (b) indicate that the complex-trace IF estimate is very noise-sensitive. In contrast, the smooth nature of (c) provides a clear indication of the structure of the subsurface.
- The seismic signal analysed here (the first column) is available as a matlab data file al100.dat.
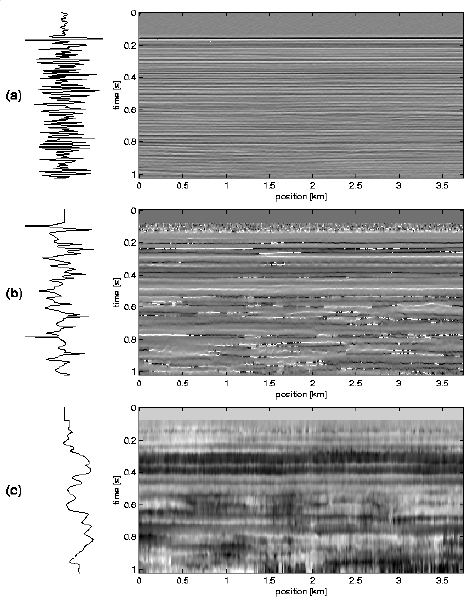
Example of 2-d seismic analysis.
(a) 2-d seismic cross-section. Trace to the left shows the amplitude of the first column of the cross-section.
(b) Complex-trace IF estimates of each column of the cross-section displayed as an intensity map (black corresponds to high frequencies and white to low frequencies).
Trace to the left shows the complex-trace IF estimate of first column.
(c) Intensity map of hybrid TFR IF estimates (see bar01hyb.ps) of the columns of the cross-section.
Trace to the left shows the hybrid TFR IF estimate of first column.
Please report any bugs or send comments regarding these programs to mcoates@ece.rice.edu.
Copyright © 2001, Digital Signal Processing Group, Rice University.