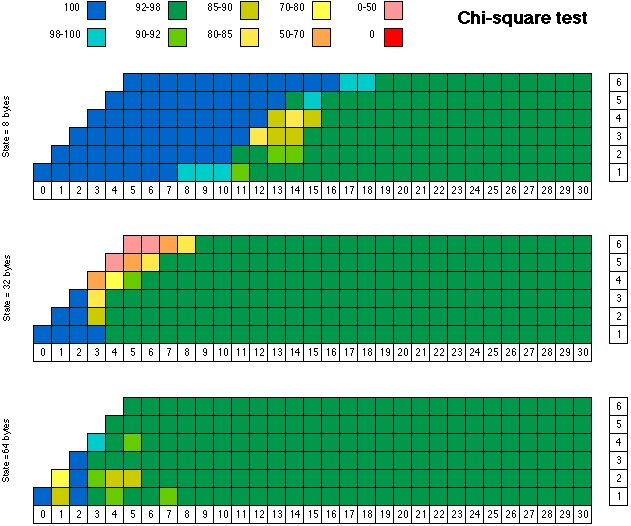
The numbers in the column to the right of each chart refer to the number of bits in the field being tested, and the numbers in the row at the bottom give the position of the most significant bit of each field. Green indicates that the results were "consistent" with the premise that random() produces a sequence of independent, uniformly distributed random numbers. Yellow and light blue results are marginal. Dark blue means that the generator NEVER FAILED the test (out of 1000 tries), whereas it should fail 5% of the time, on average. Orange and especially pink results are clearly unacceptable, while red means that the generator NEVER PASSED the test.
random() always passes this test in the low order bits with 8 bytes of state and fields sizes ranging from one to five bits. With an expected count of 100 for each possible value, the count was ALWAYS 100 (an exact match). This is much too regular to be considered random.
With larger state sizes, the expected counts and observed counts do not always agree, for any given field size and position. However, there is still too much predictability in the low order bits. For example, with a state size of 128 bytes, the ratio of 0 bits to 1 bits was always one of 106:94, 104:96, or 88:112. When the state size was 256 bytes, ratios of 80:120 and 163:37 were common.
For an explanation of the simple frequency test, click here.
Click here for more results (larger state arrays).
Return to the testing home page.