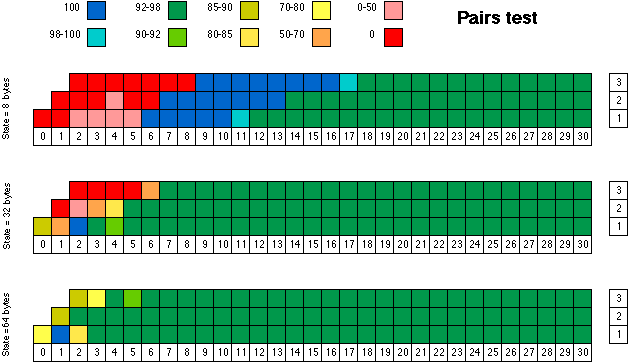

The numbers in the column to the right of each chart refer to the number of bits in the field being tested, and the numbers in the row at the bottom give the position of the most significant bit of each field. Green indicates that the results were "consistent" with the premise that random() produces a sequence of independent, uniformly distributed random numbers. Yellow and light blue results are marginal. Dark blue means that the generator NEVER FAILED the test (out of 1000 tries), whereas it should fail 5% of the time, on average. Orange and especially pink results are clearly unacceptable, while red means that the generator NEVER PASSED the test.
In investigating the results for an 8-byte state array, we find that the low order bits of successives returned by random() are highly correlated. The least significant bit alternates between 0 and 1. Bit 1 goes through the repeated cycle 0,0,1,1. The 2-bit field consisting of bits 0 and 1 repeats the cycle ...,0,1,2,3,0,1,2,3,... As you might expect, bit 2 repeats the cycle 0,0,0,0,1,1,1,1. However, as you might not expect, the 3-bit field consisting of the three low-order bits repeats the cycle 0,1,6,7,4,5,2,3. For those tests where random() never failed (the dark blue fields), the values nevertheless appeared much less predictable. With larger state arrays, random() generated values that also appeared unpredictable, even for those field sizes and positions where it always failed or always passed.
For an explanation of the pairs test, click here.
Click here for more results (larger state arrays).
Return to the testing home page.