Step 1:
Step 2:
>>
x=[1 2 3 4 5];
>>
y=[1 4 9 16 25];
Step 3:
Step 4:
Step 5:

Step 1: |
Start Matlab by double clicking on the Matlab icon on the desktop. | |
Step 2: |
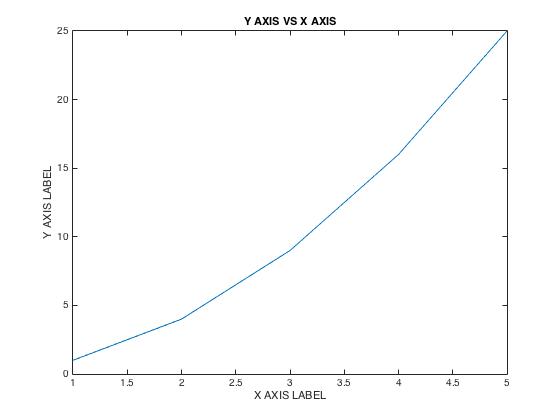
Enter the x and y values as vectors. Note that Matlab plots in the order that the points are given, so be careful that each value in the x and y vector corresponds with the next point.
>>
x=[1 2 3 4 5];
| |
Step 3: |
Type "plot(x,y)". | |
Step 4: |
To title the plot, type "title('Y AXIS VS X AXIS')". To add titles the x and y axes, use "xlabel('X AXIS LABEL')" and "ylabel('Y AXIS LABEL')". Note that you can use underscores to create subscripts.
| |
Step 5: |
To save the matlab plot, click "file" and then "save as". Make sure to save as a JPG.

|