If all we could with Labview was to make computer based copies of our conventional instruments, it would be of limited use. What makes Labview so valuable is that it is programmable. By changing the program a single box (the Lab PC) can perform the functions of a large collection of instruments, both conventional and unconventional. Some of the instruments in this collection are ready-made, for example those in the program menu entries for this course and the other ELEC lab courses.
Perhaps the greatest advantage of Labview however, is that it is user programmable: if no instrument is available which meets your requirements, you can modify an existing one or create an entirely new one.
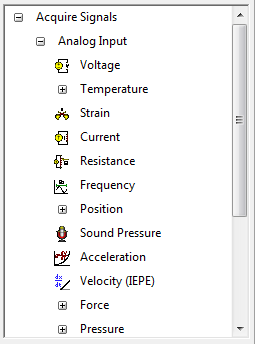
Our goal for tutorial will be to read a signal from the breadboard and see how we might change it or analyze it with Labview. The DAQ card can measure voltage so we can acquire a signal from the breadboard.
- Since we are going to build a VI from scratch, we will start with a new, blank VI. Select "New VI" from the "File" menu. A pair of windows should appear. The one on top will be a blank Front Panel window and the one on the bottom is a blank Block Diagram window.
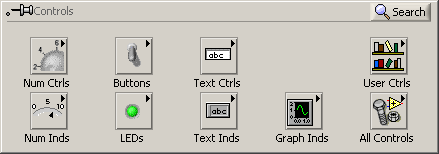
- Right click over the panel window. You will get the Controls popup:
-Now we need something for the indicator to display. Click on the Block Diagram window to bring it to the top. Note that placing the indicator on the front panel has also placed a block on the block diagram.

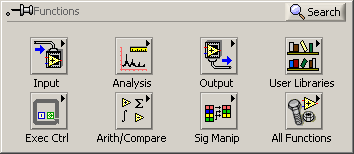
-Right-click on the Block Diagram window to bring up the Functions palette.
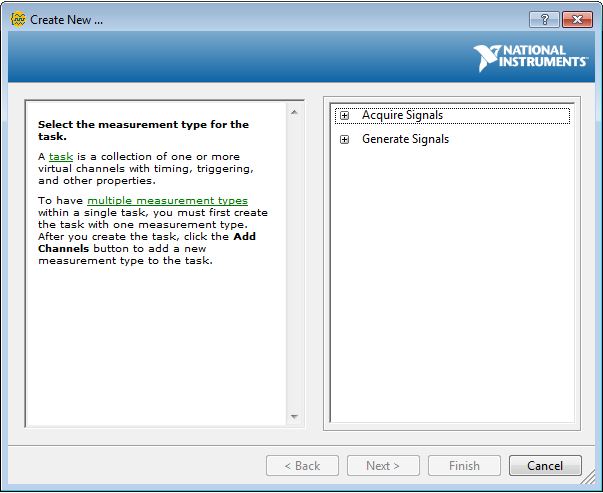
-After a second or two the "Create New .." wizard will appear.
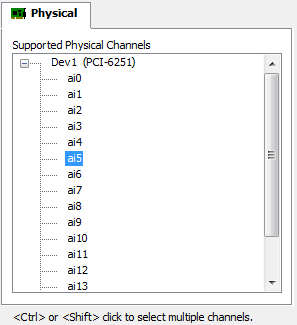
-From the list of Supported Physical Channels that appears, select "ai5" (or any other input channel you want to use),
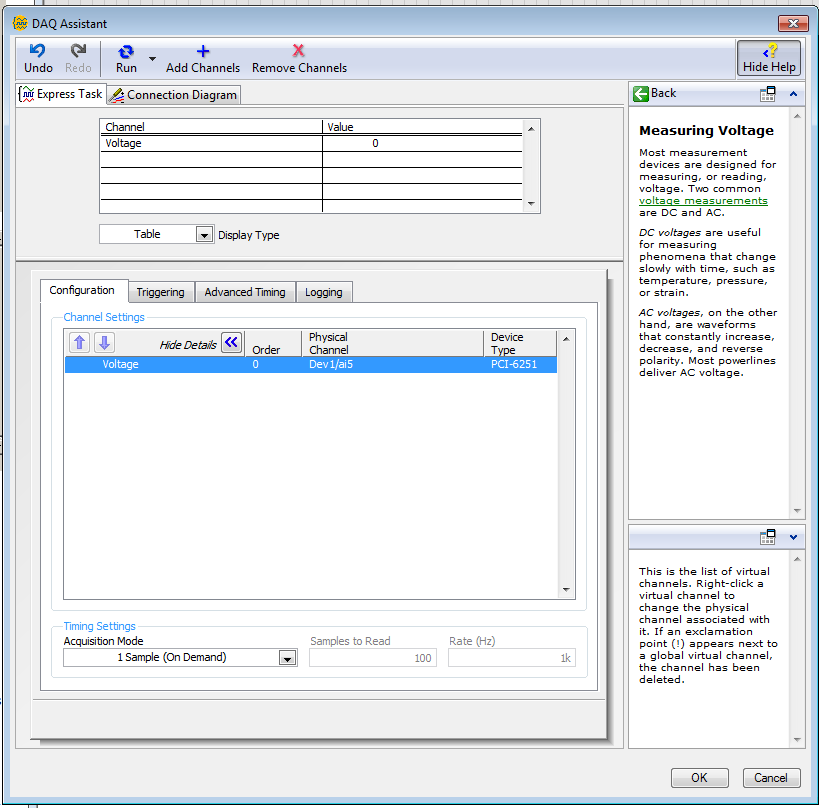
-After another brief wait, the "DAQ Assistant" dialog appears. In the "Input Range" block set "Max" to 10 Volts and "Min" to -10 Volts. Set the "Acquisition Mode" to "1 Sample (On Demand)". The panel should look like this when you are done.
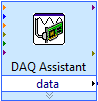
-Things will click and whir for several seconds. When it's all over, the "DAQ Assistant" box will have expanded, and should have a white band with the word "data" in it.
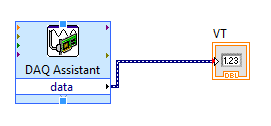
-We're almost done. All that remains is to connect the source (A/D converter block) to the destination (numeric indicator block). This process is called wiring.
Place the cursor over the small black triangle in the "data" field of the DAQ Assistant block. It should change into an icon representing a small spool of wire. Left click once and move the cursor to the small white triangle in the center of the left edge of the numeric indicator icon and left click once more. That completes our first Labview program. It should look something like this:
-Data Types: Notice that the color of the icon for the waveform graph changed from orange to blue. This is an indication that the type of data which it is displaying has changed. Like many programming languages (e.g. C) Labview maintains the notion of data types. Labview's data types include familiar ones such as integer, floating point, boolean, and string, as well as a number of unfamiliar ones (which we will try to avoid for the time being). Labview denotes data type by the color of the wire which carries it: integer wires are blue, floating point wires are orange, boolean wires are green, and strings are pink. Labview also supports collection types, such as arrays and structures. Scalars are denoted by thin solid lines, arrays by thick solid lines, and other collections by various patterned lines. The wide dark blue lines with internal dashes are a composite data type called dynamic data.
Dynamic data contains a lot of information in addition to the value of the sample, for example, the time at which the sample was taken, whether any errors were made in previous handling of the sample, etc. This means that when we connect our signal to the waveform display, it can automatically display the correct time scale on the x-axis, rather than just the sample number.
-Let's try it out. Click on the Front Panel window to bring it to the top. Run the VI by clicking on the Run arrow or by typing Ctrl-R. The V_emg numeric indicator should display the voltage you see on the oscilloscope.
-Select Save As... from the File menu. Set the Save in: field to an appropriate directory (e.g. the desktop, your network home directory, or your local Group nn folder).
-Caution: Always set the destination directory when saving a VI. Never try to save a VI in the default directory. When everything is in order, press the Save button.
-Now that you have the signal input into Labview, there are many things you can do with it. Go through various Functions you can add to your block diagram to see how to filter, perform FFT, display a spectrogram, etc.
-Take a look at example code from previous labs to see how signals can be displayed - i.e., as waveforms or spectrographs.
-You can also find Labview tutorials on youtube to refer to.