Although the
process we want to perform
is a fairly simple one,
if you have never written a Labview program before, even simple
processes
are difficult.
So we will approach our final goal in a sequence of smaller steps.
The first step required for either our transmitter or receiver
is to digitize the analog input signal,
so let's write a VI that does that and displays the result.
| |
|

|
Step 1: |
|
Since we are going to build
a VI from scratch,
we will start with a new, blank VI.
Select
"New VI"
from the "File" menu.
A pair of windows should appear.
The one on top will be a blank Front Panel window:
 and the one on the bottom is a blank Block Diagram window:

|
Step 2: |
|
Our first
task
is to
read and display an analog input signal.
Since the front panel window is on top, let's
take care of the display first.
Right click over the panel window.
You will get the Controls popup:
 Place the cursor over the "Graph Inds"
button to get the
Graph Indicators popup:
Place the cursor over the "Graph Inds"
button to get the
Graph Indicators popup:
 Left click on the "Graph" button.
|
Step 3: |
|
A group of boxes with an open hand cursor will
appear on the front panel.
 Move this to an aesthetically pleasing location and left click.
You will get a numeric display labeled "Waveform Graph."
Move this to an aesthetically pleasing location and left click.
You will get a numeric display labeled "Waveform Graph."
 The fact that the words "Waveform Graph" are highlighted means
that they are selected and can be edited.
Let's change the name so that we can remember what is
being displayed.
The fact that the words "Waveform Graph" are highlighted means
that they are selected and can be edited.
Let's change the name so that we can remember what is
being displayed.
Type "Output Signal" and left click the check-mark box at the
upper left of the window (
 ).
The indicator is now ready for use.
).
The indicator is now ready for use.
|
Step 4: |
|
Now we need something for the indicator to display.
Click on the Block Diagram window to bring it to the top.
This may also bring up the Functions palette.
If so, move it out of the way or click the close box.
Note that placing the indicator on the front panel
has also placed a block on the block diagram.
 This block is the
icon
associated with the indicator.
We can provide
a signal
for it to display
by connecting it to a signal source.
The source we will use will be
one of the A/D converter inputs.
This block is the
icon
associated with the indicator.
We can provide
a signal
for it to display
by connecting it to a signal source.
The source we will use will be
one of the A/D converter inputs.
|
Step 5: |
|
If you closed the Functions palette in the previous
step, right click to bring it up.
 From the Functions popup, select "Input".
This will bring up the Input palette.
From the Functions popup, select "Input".
This will bring up the Input palette.
 From this select "DAQ Assist"
This will bring up a block labeled "DAQ Assistant,
attached to a hand cursor.
From this select "DAQ Assist"
This will bring up a block labeled "DAQ Assistant,
attached to a hand cursor.
 Position this somewhere to the left of the
VT indicator block
and left click.
Position this somewhere to the left of the
VT indicator block
and left click.
|
Step 6: |
|
Wait patiently.
You may briefly see a dialog labeled "Initializing".
After a second or two the "Create New .." wizard will appear.
 Click on "Acquire Signals" in the left hand column, then click on
"Analog Input"
then on
"Voltage" in the list that appears.
Click on "Acquire Signals" in the left hand column, then click on
"Analog Input"
then on
"Voltage" in the list that appears.

|
Step 7: |
|
From the list of Supported Physical Channels
that appears, select "ai5",
 then click the "Finish" button at the bottom of the frame.
|
Step 8: |
|
After another brief wait, the "DAQ Assistant" dialog appears.
In the "Input Range" block set "Max" to 10 Volts
and "Min" to -10 Volts.
Set the "Terminal Configuration" field to "RSE".
The upper half of the panel should look like this when you are done.
 When you're done, click the "OK" button.
|
Step 9: |
|
Things will click and whir for several seconds.
When it's all over, the "DAQ Assistant" box will have
expanded, and should have a white band with the word
"data" in it.

|
Step 10: |
|
We're almost done. All that remains is to connect the
source (A/D converter block) to the destination
(numeric indicator block). This process is called
wiring.
Place the cursor over the small black triangle in the "data"
field of the DAQ Assistant block.
It should change into an icon representing a small spool of wire.
Left click once and move the cursor to the small white
triangle in the center of the left edge of the
numeric indicator icon and left click once more.
That completes our first Labview program.
It should look something like this:

|
Data Types: |
|
Notice that the color of the icon for the waveform graph
changed from orange to blue. This is an indication that
the type of data which it is displaying has changed.
Like many programming languages (e.g. C) Labview
maintains the notion of
data types.
Labview's data types
include familiar ones such as integer, floating point,
boolean, and string,
as well as a number of unfamiliar ones
(which we will try to avoid for the time being).
Labview denotes data type by the color of the wire
which carries it: integer wires are blue, floating point
wires are orange, boolean wires are green, and
strings are pink.
Labview also supports collection types, such as arrays
and structures.
Scalars are denoted by thin solid lines, arrays by
thick solid lines, and other collections by various
patterned lines.
The wide dark blue lines with internal dashes are
a composite data type called
dynamic data.
Dynamic data contains a lot of information in addition
to the value of the sample,
for example, the time at which the sample was taken,
whether any errors were made in previous handling of the
sample, etc.
This means that when we connect our signal to the
waveform display,
it can automatically display the correct time scale on the
x-axis, rather than just the sample number.
|
Step 11: |
|
Let's try out our VI.
First we need an analog signal to display.
Set the function generator to produce a 1 V pp
100 Hz sinewave.
Connect the output of the function generator to analog
input channel 5.
This is labeled
ai5
in the DAQ Assistant
and
ach5
on the interface socket strip
(pin 47).
|
Step 12: |
|
Click on the Front Panel window to bring it to the top.
Run the VI by clicking on the Run arrow
or by typing Ctrl-R.
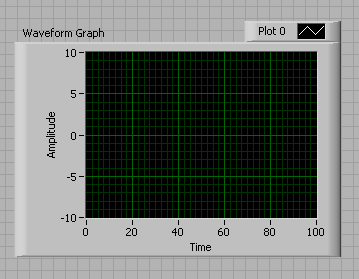
The
graph indicator
should display about 10 cycles of a sine wave.
|
Step 13: |
|
It's always a good idea to save your work from time to time,
and since we currently have a working VI, this would be a
good time.
Select
Save As...
from the
File
menu.
Set the
Save in:
field to an appropriate directory
(e.g. the desktop, your network home directory, or
your local
Group nn
folder).
Caution
Always set the destination directory when saving a VI.
Never try to save a VI in the default directory.
|
If "Untitled.vi"
seems like an inadequate name for such a momentous work,
think of a more descriptive one (e.g. "lab9.vi")
and enter it into the
File name
field.
When everything is in order, press the
Save
button.
|
| |
|
|
Step 1: |
|
Go to the block diagram window and right click
to get the
Functions
palette.
move the cursor to the
Arith/Compare
block to bring up the
Arithmetic and Comparison
palette.
 Move to the
Numeric
block to bring up the
Express Numeric
palette.
Move to the
Numeric
block to bring up the
Express Numeric
palette.
 This has everything we need: addition, multiplication,
and constants (for +1).
This has everything we need: addition, multiplication,
and constants (for +1).
|
Step 2: |
|
Let's start by adding one.
Move the cursor over the symbol labeled
Add
and left click.
Position the icon below the existing components on
the diagram and left click to put it down.
Note that while the cursor is over the symbol there
are three small circles near the vertices of the triangle.
 These indicate the connection points and will disappear
when the cursor moves away.
These indicate the connection points and will disappear
when the cursor moves away.
|
Step 3: |
|
Now let's do the one.
Select
Num Const
from the
Express Numeric
palette and place the resulting block above and to the left
of the subtract icon.
The highlighted text indicates that you can enter a new value.
Type
1
and press
Enter
or click the check box at the upper left of the window.

|
Step 4: |
|
At this point you may have noticed a change in the appearance of the
toolbar: the run button has changed from a white arrow to a
gray broken arrow
(
 ).
This means that there is an error in the
block diagram and the VI won't run.
To find out what the error is, click on the broken arrow button.
).
This means that there is an error in the
block diagram and the VI won't run.
To find out what the error is, click on the broken arrow button.
If you do this you should find that the problem is an
unwired or bad terminal.
This is because the adder currently has no inputs.
We will fix this problem shortly.
|
Step 5: |
|
We need to disconnect the A/D output from the input to the
waveform graph so we can replace it with the output of the
adder.
Place the cursor over the wire and double click.
This converts the wire to a highway of marching ants,
which indicates that it is selected.
Press the
DELETE
key to remove the wire.
|
Step 6: |
|
All that remains is to make the connections.
We already know how to do this from the previous Part:
place the cursor over a connection point, wait for it
to turn into a spool of wire, click, move to the other
terminal, and click again.
When you're done it should look something like this:

|
Step 7: |
|
Let's test what we have so far.
Go to the front panel and click on the
Run
button.
If all is well,
the output should now be offset by one volt.
All that's left is to multiply this new signal
by
 to get
  , the transmitter output.
|
Step 8: |
|
Stop the VI.
Go to the block diagram and disconnect the adder output
from the Waveform Graph input.
|
Step 9: |
|
From the
Express Numeric
palette,
select a multiply block and place it between the adder and
the waveform graph icon.
|
Step 10: |
|
From the
Functions
palette,
select
Input,
then
Simulate Sig.
Place the
Simulate Signal
block
above the
DAQ Assistant
block and left click to place it.
In the
Configure Simulate Signal
accept the default values and click
OK
A white band labeled
Sine
will appear at the bottom of the block.
|
Step 11: |
|
Connect the
Sine
output of the
Simulate Signal
block to one input of the multiplier
and the output of the adder to the other.
connect the output of the multiplier to the
Waveform Graph
When you're done it should look
like this:

|
Step 12: |
|
Click
Run.
The signal on the waveform graph probably doesn't
look much like the AM waveforms you've seen in class.
This is because the default frequency for the
Simulate Signal
block is 10.1 Hz
which is much less than the 100 Hz frequency of
the function generator signal.
Our model for modulation assumes that the carrier frequency
is much greater than the signal frequency.
Let's fix that before we proceed.
|
Step 13: |
|
Double click on the
Simulate Signal
block.
In the
Signal
sub-panel, set
Frequency (Hz)
to 175000
(this is the center of our 160-190 kHz band).
In the
Timing
sub-panel,
set
Samples per second (Hz)
to 1000000,
set
Number of samples
to 16384, and uncheck the
Automatic
box.

|
Step 14: |
|
We also need to set the sample rate and block size
of the A/D converter to the same values.
Double click on the
DAQ Assistant
block.
In the lower sub-panel, set
Acquisition Mode
to
Continuous,
set
Samples to Read
to 16384,
and set
Rate (Hz)
to 1000000.

|
Step 15: |
|
Restart the VI.
The display should look more like a proper AM signal.
(If necessary, adjust the function generator frequency
for a stable display.)
|
Step 16: |
|
Stop the VI and save it in a persistent location.
|
| |
|
|
Step 1: |
|
Recall that the DAQ card has two analog voltage outputs:
dac0
and
dac1.
Unlike the analog inputs which have different sensitivities,
there's no real difference between these, so we'll
arbitrarily choose
dac0
for our output.
Use a BNC patch cable to connect
J1-1
to
CH 1
of the oscilloscope.
On the interface module connector strip,
connect
J1-1
(socket strip pin 1)
to
dac0
(pin 51).
|
Step 2: |
|
We create D/A output blocks in nearly the same way we did
A/D input blocks, using the DAQ Assistant.
From the Functions palette, select
Output,
then
Place the resulting block inside the while loop,
above the waveform graph icon.
|
Step 3: |
|
Once it is placed, you will get a
Create New ...
wizard, just as you did with the input block in
Part 1.
This time, select
Analog Output,
then
Voltage.
From the list of Supported Physical Channels, select
ao0,
then click the
Finish
button at the bottom of the frame.
|
Step 4: |
|
When the DAQ Assistant dialog appears,
set the
Output Range
to have a
Max
of 10 Volts and a
Min
of -10 Volts.
Set the
Generation Mode
to
Continuous.
When finished, click the
OK
button.
|
Step 5: |
|
There will be a brief flurry of activity, the
DAQ Assistant
block will expand, and a white band containing the word
data
will appear.
|
Step 6: |
|
Wire output of the multiplier to the
data
input
of the D/A output block.
To connect to an existing wire (in this case the one
between the
multiplier and the
Output Signal
display block),
move the cursor
near,
but not directly on,
the wire.
If you place the cursor on the wire
it will turn into an arrow, indicating that you can
select the wire.
|
Step 7: |
|
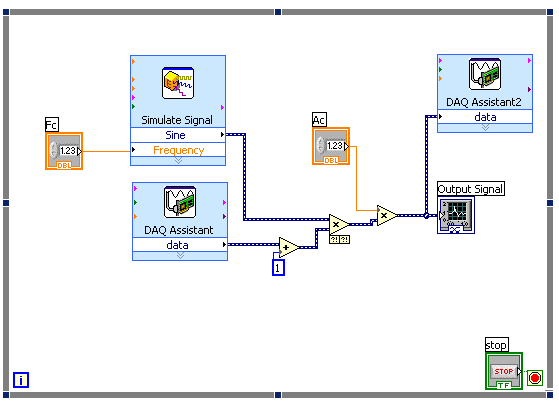
When complete, your VI should look
like this:

|
Step 8: |
|
Press
Run
and verify on the oscilloscope
that the output is the same AM signal
shown on the waveform graph.
|
Step 9: |
|
We now have a working transmitter VI.
Save it in a safe place.
|