The Fourier series describes
a periodic signal by representing it as a weighted sum of
harmonics of the fundamental frequency (![]() ):
):
The Fourier transform extends this concept to arbitrary signals by considering frequency to be a continuous variable:
![]() (or
(or ![]() for periodic signals) is called the
spectrum
of
for periodic signals) is called the
spectrum
of ![]() and describes the signal in terms of
its frequency content.
Since the Fourier transform is invertable, we can use
either
and describes the signal in terms of
its frequency content.
Since the Fourier transform is invertable, we can use
either ![]() or
or ![]() to represent the signal.
to represent the signal.
This is an extremely useful tool if we're going to try to separate signal from noise by filtering. If we know the spectra of the signal and the noise we can try to design a filter which passes as much of the former and rejects as much of the latter as possible.
Since both the transfer function and the spectrum are plotted with the same x-axis (frequency) we can simply overlay the frequency response of a filter on the spectrum of a signal to see the effect. This makes it easy to visually evaluate prospective filters.
Here's an example of a spectrogram, in this case of a 2 kHz sine wave.
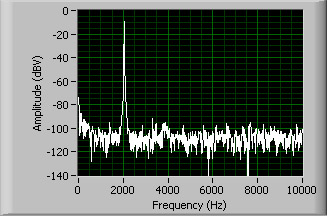
We would expect to see a single line at 2 kHz and zero
everywhere else.
In fact, due to the inevitable noise there's a very small
but non-zero signal everywhere else.
As an aside, since the y-axis is logarithmic
(dBV means "decibels with respect to 1 volt"),
zero would be at ![]() .
.