|
| ||
Spectrum analyzer noise floor: |
Set the spectrum analyzer to 9 MHz center, 10 kHz span, -50 dBm reference level.
Maximize the sensitivity by setting the attenuator to 0 dB.
(This requires the use of the numeric keypad and the
dB
key.)
With no input connected, measure total power and average power.
Repeat the measurement for center frequencies of 2 MHz and 300 kHz
(the frequencies we will be using in the test).
| |
Question 3: |
Explain the relationship between the average and total power readings.
| |
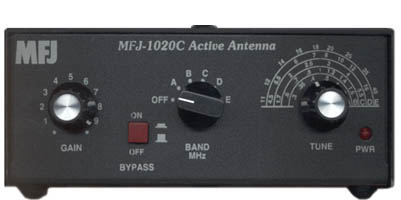
Preamplifier gain: |
Connect the signal generator to the input of the
MFJ-1020C
preselector/preamp, and connect the output to the spectrum analyzer.
Set the signal generator and spectrum analyzer frequencies to 9 MHz.
Set the signal generator output level to -80 dBm.
Set the preamp
GAIN
to maximum,
select the appropriate
BAND,
and adjust the
TUNE
control for maximum output.
Repeat this measurement for 300 kHz and 2 MHz
and note the gain in each case.
| |
Question 4: |
Based on the previous two measurements, what is the minimum equivalent
input noise level
(in dBm/Hz) that we will be able to measure.
How does this compare with the input thermal noise.
| |
Preamplifier noise: |
Disconnect the signal generator and turn its RF output off.
Place a 50 Ω terminator on the preamplifier input.
Connect the preamp output to the spectrum analyzer.
Use the same procedure as above to measure the noise power in
a 10 kHz band, at center frequencies of 300 kHz, 2 MHz,
and 9 MHz.
When finished, return the spectrum analyzer attenuator setting to
AUTO.
| |
Question 5: |
What if anything can you say about the noise figure of the preamp? |
|
| ||
Characterizing the signal generator and spectrum analyzer: |
Just finding harmonics on the spectrum analyzer doesn't mean they came from the
DUT, they may have been present on the signal generator output, or generated
internally in the spectrum analyzer.
Before we proceed, we need to find out to what extent this is the case.
Connect the signal generator directly to the spectrum analyzer. Set the signal generator to 9 MHz. Set the spectrum analyzer span to 10 kHz and initially set the frequency to 9 MHz and the reference level to -20 dBm. Starting with an output level of -80 dBm, and increasing in steps of 10 dBm, plot the spectrum analyzer peak value vs. signal generator output level. (Adjust spectrum analyzer reference level as necessary.) This plot should be a straignt line (with units in dBm). If it is not, take additional measurements at closer spacings as necessary to accurately define its shape.
Now for the harmonics.
Reset the reference level to -20 dBm, and set the spectrum analyzer
center frequency to 18 MHz (to view the second harmonic).
Starting at -80 dBm, increase the signal generator output until a peak
is visible on the spectrum analyzer. Continue increasing in 3 dB steps
and note the corresponding second harmonic output levels.
Set the spectrum analyzer to 27 MHz and repeat the procedure to measure
the third harmonic.
Plot these values on your graph along with the fundamental response.
| |
Question 6: |
Referring to the manuals for the signal generator and the spectrum analyzer,
are the results you obtained in the previous step consistant with the
specifications for the instruments?
Can you say whether or to what extent the harmonics are produced in the signal
generator or the spectrum analyzer?
| |
Gain compression: |
Disconnect the signal generator output from the spectrum analyzer and connect it to the input of the preamp. Connect the output to a BNC-T on the scope and then to the spectrum analyzer. (Why in that order rather than spectrum analyzer first and scope last?) Set the signal generator output to -80 dBm. Set up the spectrum analyzer to observe the fundamental (9 MHz), set the preamp GAIN to maximum, and tune for peak output.
Increase the signal generator output in steps of 5 dB until you reach -10 dBm.
At each point, note the peak output level on the spectrum analyzer (reset the reference
level as necessary), and examine the waveform on the scope.
Plot output vs. input (in dBm).
This will not be a straight line, especially at higher signal levels.
If necessary, go back and take measurements at intermediate points
in order to accurately define the non-straight portion of the curve.
Estimate the 1 dB compression point.
| |
Harmonic generation: |
Repeat the procedure of the previous step, with the spectrum analyzer set to
18 and 27 MHz, to determine the amplitudes of the second and third harmonics.
Plot these points on your graph along with the curve for the fundamental.
| |
Question 7: |
Comparing the results of this measurement with those of the signal generator/spectrum
analyzer pair alone, is it possible to make any meaningful statement about the
distortion of the preamplifier?
If so, estimate the Taylor series coefficients, assuming the nonlinearity
to be described by a third order series.
| |
Question 8: |
Do these measurements allow a valid estimate of intermodulation performance? If so, how? If not, why not? |